Table of Contents
Fibonacci retracement is a famous technical analysis tool traders use to identify potential support and resistance levels in a market. It is based on the Fibonacci sequence, a series of numbers where each number is the sum of the two preceding ones. The key Fibonacci levels used in trading are derived from the ratios between these numbers.
Fibonacci retracement levels are a technical analysis tool to identify potential support and resistance levels where the price could reverse direction. These levels are based on the Fibonacci sequence, a series of numbers where each number is the sum of the two preceding ones.


Key Fibonacci Levels
- 0.0% – This represents the start of the move.
- 23.6% – A minor retracement level.
- 38.2% – A deeper retracement level, indicating a more substantial possibility of a reversal.
- 50.0% – Not a Fibonacci ratio, but an ordinary retracement level where prices often find support or resistance.
- 61.8% – Known as the “golden ratio,” this is a critical level where significant reversals can occur.
- 100.0% – This represents the end of the move.
Key Points About Fibonacci Retracement Levels
- Best Used in Trending Markets: The Fibonacci tool works best when the market is trending. This means that the price consistently moves in one direction, either upward or downward.
- Predictive Nature: Fibonacci retracement levels are considered predictive technical indicators because they attempt to identify where the price may be in the future based on historical movements.
- Retracement Strategy:
- In an Uptrend: Look to go long (buy) on a retracement at a Fibonacci support level.
- In a Downtrend: Look to go short (sell) on a retracement at a Fibonacci resistance level.
- Theory Behind Fibonacci Retracement: The theory is that after the price begins a new trend direction, it will retrace or return partway back to a previous price level before resuming in the direction of its trend.

Finding Fibonacci Retracement Levels
To find Fibonacci retracement levels, follow these steps:
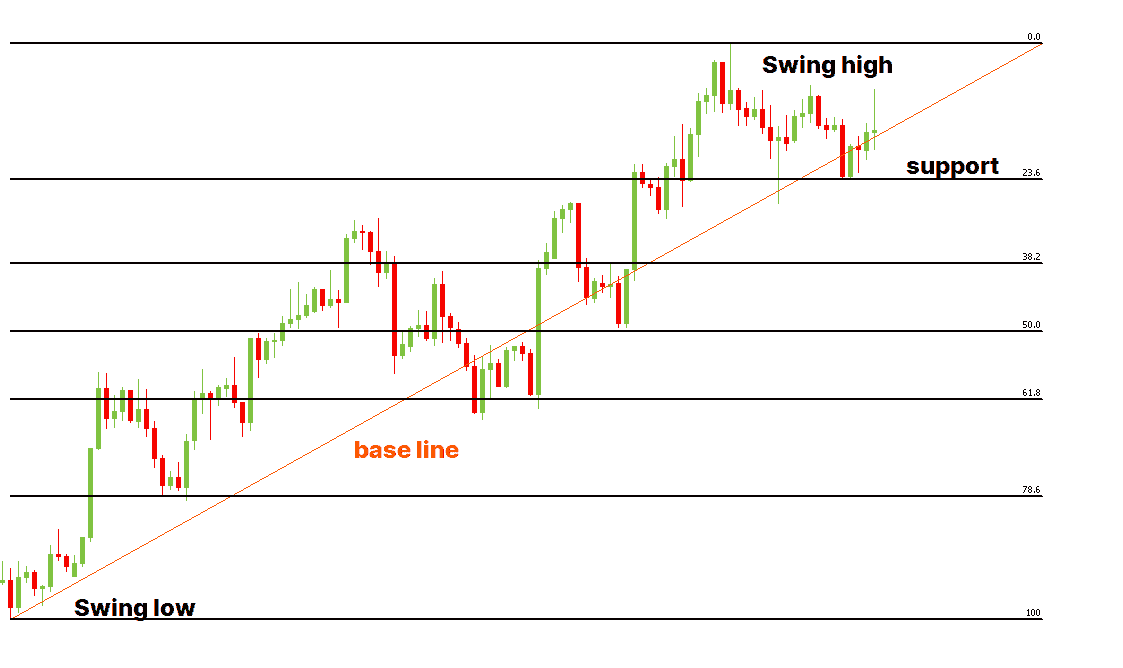
- Identify Recent Significant Swing Highs and Swing Lows:
- Swing High: A peak reached by the price before a downward movement.
- Swing Low: A trough reached by the price before an upward movement.
- Drawing Fibonacci Levels:
- For Downtrends: Click on the Swing High and drag the cursor to the most recent Swing Low.
- For Uptrends: Click on the Swing Low and drag the cursor to the most recent Swing High.
Example Application in Currency Markets
Example 1: Uptrend
- Identify Swing Low and Swing High:
- Assume the price moves from $1.1000 (Swing Low) to $1.2000 (Swing High).
- Draw the Fibonacci Levels:
- Using the Fibonacci tool, draw from $1.1000 to $1.2000.
- Observe the Retracement Levels:
- 23.6% retracement at $1.1764
- 38.2% retracement at $1.1618
- 50.0% retracement at $1.1500
- 61.8% retracement at $1.1382
If the price retraces to the 38.2% level at $1.1618 and finds support, it might be an excellent point to enter a long position, anticipating the continuation of the uptrend.
Example 2: Downtrend
- Identify Swing High and Swing Low:
- Assume the price moves from $1.2000 (Swing High) to $1.1000 (Swing Low).
- Draw the Fibonacci Levels:
- Using the Fibonacci tool, draw from $1.2000 to $1.1000.
- Observe the Retracement Levels:
- 23.6% retracement at $1.1236
- 38.2% retracement at $1.1382
- 50.0% retracement at $1.1500
- 61.8% retracement at $1.1618
If the price retraces to the 61.8% level at $1.1618 and finds resistance, it might be an excellent point to enter a short position, anticipating the continuation of the downtrend.
How to use Fibonacci retracements in MT4?
Fibonacci retracement levels are valuable in technical analysis, and MT4 provides a straightforward way to draw them on your charts.
Here’s a step-by-step guide to drawing Fibonacci retracement levels in MT4:
Step 1: Open MetaTrader 4
- Launch your MT4 trading platform.
- Open the chart of the currency pair or asset you want to analyze.
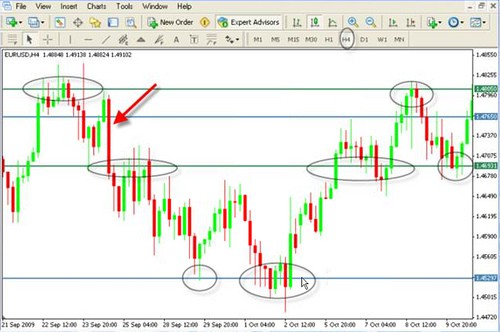
Step 2: Identify Swing Highs and Lows
- Uptrend: Identify the most recent Swing Low and Swing High.
- Downtrend: Identify the most recent Swing High and Swing Low.
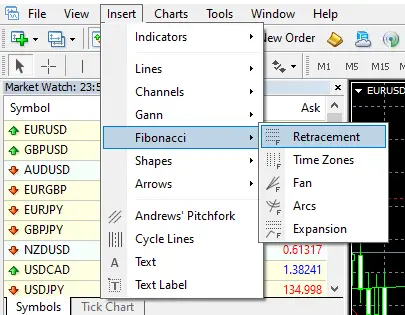
Step 3: Select the Fibonacci Retracement Tool
- In the toolbar at the top of the MT4 platform, click on the “Insert” menu.
- Hover over “Fibonacci” and then select “Retracement.”
Step 4: Draw the Fibonacci Retracement Levels
- For an Uptrend:
- Click on the Swing Low point.
- Drag the cursor to the Swing High point.
- Release the mouse button to draw the Fibonacci retracement levels.
- For a Downtrend:
- Click on the Swing High point.
- Drag the cursor to the Swing Low point.
- Release the mouse button to draw the Fibonacci retracement levels.
Step 5: Analyze the Levels
The Fibonacci retracement levels will appear on the chart as horizontal lines at critical levels (23.6%, 38.2%, 50.0%, 61.8%, etc.). These levels indicate potential support and resistance points where the price might reverse.
Example: Drawing Fibonacci Levels in an Uptrend
- Identify Swing Points:
- Swing Low: $1.1000
- Swing High: $1.2000
- Draw the Levels:
- Click on $1.1000 (Swing Low).
- Drag to $1.2000 (Swing High).
- Release the mouse button.
The Fibonacci levels (23.6%, 38.2%, 50.0%, 61.8%) will be displayed between $1.1000 and $1.2000.
Customizing Fibonacci Levels
- Right-click on any of the Fibonacci retracement levels on the chart.
- Select “Fibo Properties” from the context menu.
- In the “Fibo Levels” tab, you can add, modify, or delete levels.
- You can also change the colors and styles of the lines to suit your preferences.
Tips for Using Fibonacci Retracement in MT4
- Combine with Other Indicators: Use Fibonacci retracement levels with other technical indicators (e.g., moving averages, RSI) to confirm potential reversal points.
- Adjust Time Frames: Analyze Fibonacci retracement levels on different time frames (e.g., daily, hourly) to get a broader view of potential support and resistance levels.
- Practice and Backtest: To improve your accuracy and confidence, practice drawing Fibonacci levels and backtesting your strategies on historical data.
Following these steps, you can effectively draw and use Fibonacci retracement levels in MT4 to enhance your trading strategy and identify potential market reversals.
Why Fibonacci Levels Are Important
- Psychological Significance: Many traders watch these levels, creating a self-fulfilling prophecy where prices react to them because so many participants expect them to.
- Identification of Potential Reversal Points: Fibonacci levels help traders identify where the price might reverse after a pullback, allowing them to enter or exit trades at optimal points.
- Support and Resistance: These levels often act as strong support or resistance, helping traders effectively set stop-loss and take-profit levels.
- Risk Management: Traders can better manage their risk by using Fibonacci levels. They can place stop-loss orders at key levels and take profits at predicted points of reversal.
Using Fibonacci Retracement in Trading
To use Fibonacci retracement, follow these steps:
- Identify the Trend: Determine whether the market is uptrend or downtrend.
- Draw the Fibonacci Retracement Tool: Draw from the swing low to the swing high in an uptrend. In a downtrend, draw from the swing high to the swing low.
- Observe the Levels: Watch how the price reacts to the Fibonacci levels, especially 38.2%, 50%, and 61.8%.
Example in a Bullish Market
- Identify Swing Low and High: Suppose the price of a stock moves from $100 (swing low) to $200 (swing high).
- Draw the Retracement Levels: Use the Fibonacci tool to draw the retracement from $100 to $200.
- Monitor Reactions: The key levels would be:
- 23.6%: $176.4
- 38.2%: $161.8
- 50%: $150
- 61.8%: $138.2
If the price retraces to $161.8 (38.2%) and finds support, it might be an excellent point to enter a long position, anticipating the continuation of the uptrend.
Conclusion
Fibonacci retracement levels are essential to technical analysis. They provide traders with a framework to predict potential price reversals, support, and resistance levels. By integrating Fibonacci levels into their trading strategy, traders can enhance their decision-making process and improve their chances of successful trades.

He is an expert in financial niche, long-term trading, and weekly technical levels.
The primary field of Igor's research is the application of machine learning in algorithmic trading.
Education: Computer Engineering and Ph.D. in machine learning.
Igor regularly publishes trading-related videos on the Fxigor Youtube channel.
To contact Igor write on:
igor@forex.in.rs
Related posts:
- Fibonacci 88.6% Level – Important Fibonacci Retracement Levels
- Fibonacci Retracement Trading Strategy! – Golden Ratio Strategy!
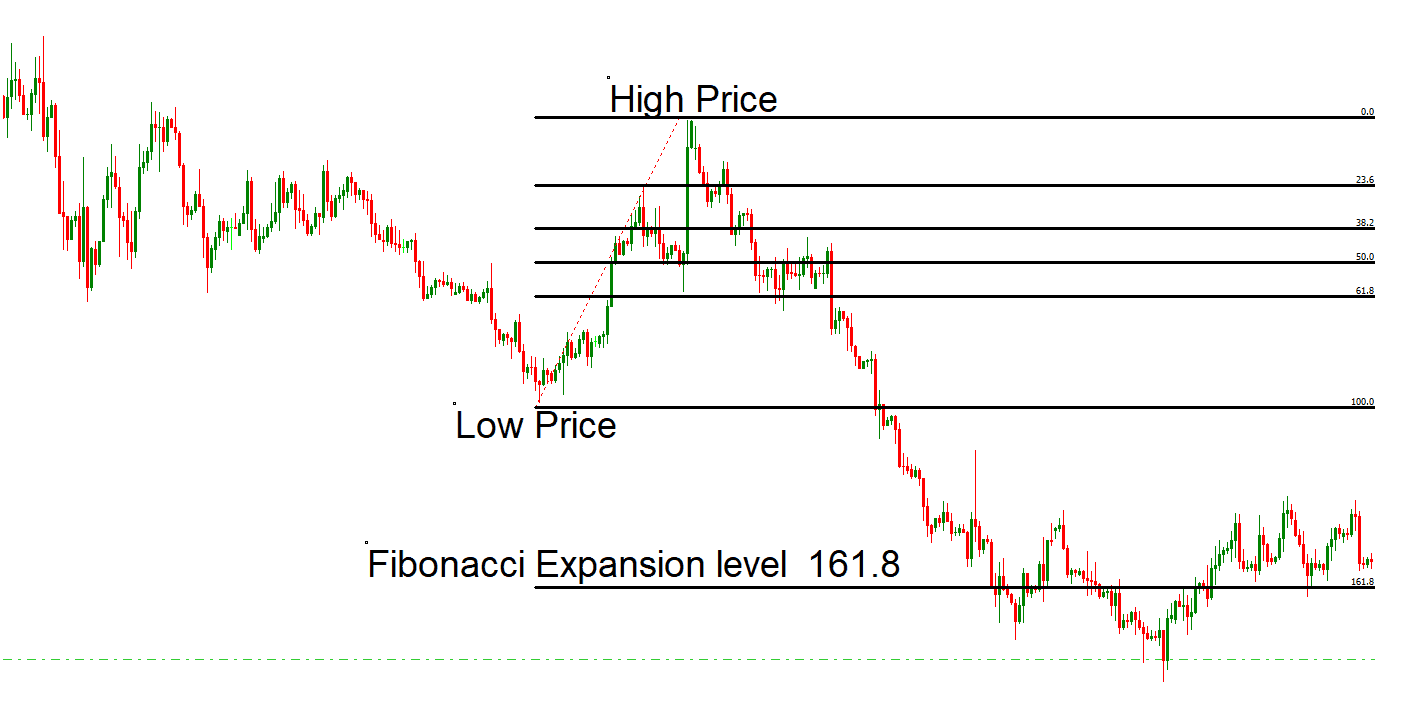
- Fibonacci Expansion Levels – Download Auto Fibonacci Extension Indicator MT4
- Fibonacci Golden Zone Practical Example!
- Where is Fibonacci Indicator in HF Markets Platform?
