In the previous article, we said that share price, or stock price, represents the cost to purchase a single share of a company and is a crucial indicator of the company’s valuation on the stock market. This price fluctuates based on various factors, including supply and demand dynamics, the company’s financial health, market sentiment, and broader economic conditions. We covered the intricacies of how share prices are determined and their significance to both companies and investors in our previous discussion, delving into aspects such as the initial setting of share prices during an IPO, factors influencing price changes post-IPO, and strategic actions like dividends and stock splits that companies use to manage their share price.
But how to find a price per share?
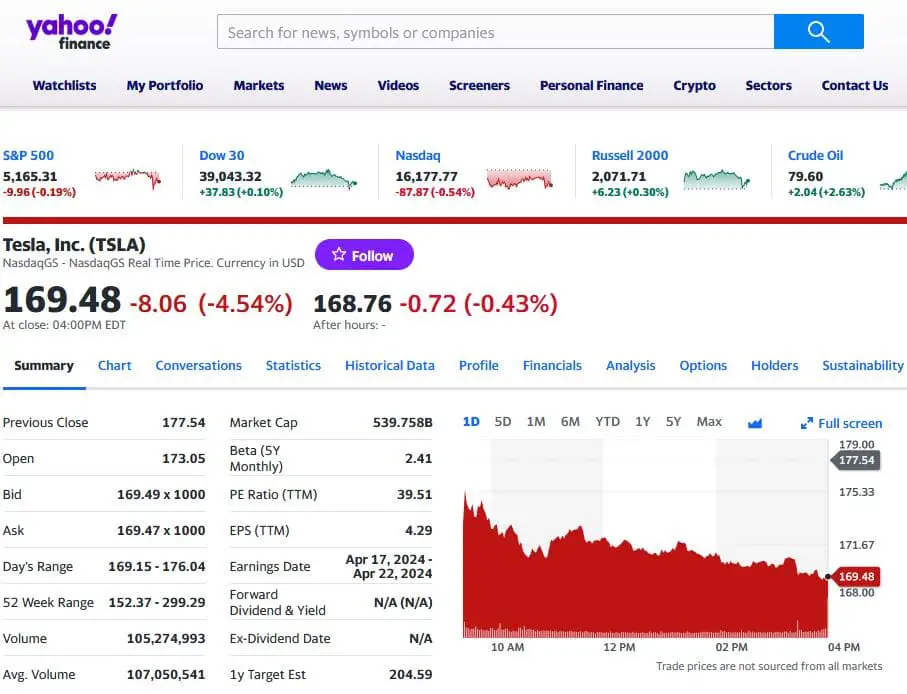
To find a current market price per share, visit financial websites such as Yahoo Finance, Trading View, Bloomberg, etc., type the company’s name, and check the current price value. The Market Price Per Share of Common Stock is determined by the forces of supply and demand in the stock market, reflecting investors’ current valuation of a company’s worth based on its financial performance, market conditions, and future growth prospects.


See the example how to find Tesla Inc. share price on Yahoo Finance:


You can find a price per share on the following websites:
- Investing.com – https://www.investing.com/: A comprehensive financial website offering real-time quotes, streaming charts, financial news, technical analysis, and more.
- Bloomberg – https://www.bloomberg.com/markets/stocks: Provides high-quality news and analytics for financial professionals and individual investors.
- Yahoo! Finance – https://finance.yahoo.com/: Offers free stock quotes, up-to-date news, portfolio management resources, and market data.
- MarketWatch – https://www.marketwatch.com/: A leading innovator in business news, personal finance information, and market data.
- Charles Schwab – https://www.schwab.com/: Offers brokerage, banking, and financial advisory services through its operating subsidiaries.
- Fidelity—https://www.fidelity.com/—offers financial planning and advice, retirement plans, wealth management services, trading, and brokerage services.
- Interactive Brokers LLC – https://www.interactivebrokers.com/: Known for its advanced trading platform, offering trading in various securities.
- Morningstar, Inc. – https://www.morningstar.com/ —is a global financial services firm offering various investment management products and services, including research and analysis.
- Robinhood – https://robinhood.com/: Popular with retail investors for commission-free trading of stocks, ETFs, and cryptocurrencies.
- Seeking Alpha—https://www.seekingalpha.com/: This is a platform for investment research with broad coverage of stocks, asset classes, ETFs, and investment strategies.
- StockCharts.com – https://www.stockcharts.com/: Provides tools for the technical analysis of financial markets, including various chart tools.
- The Motley Fool—https://www.fool.com/—offers a variety of financial and investing advice, with a focus on stock market picks.
- TradingView – https://www.tradingview.com/: A social network for traders and investors in the stock, futures, and forex markets!
- Webull – https://www.webull.com/: An investment app offering commission-free stock and exchange-traded fund (ETF) trading.
- CNBC – https://www.cnbc.com/: Provides up-to-the-minute news and analysis on the stock market, Finance, and economy.
- Wall Street Journal – https://www.wsj.com/market-data: Renowned for its financial news and market data analysis.
- Barchart—https://www.barchart.com/: Offers data on stocks, futures, ETFs, and forex markets, along with various analysis tools.
- Stockstracker – http://www.stockstracker.com/: A live stock market tracker providing free stock charts and streaming quotes.
This website does not only show current stock prices. It also provides critical fundamental data and market value indicators.
Market value indicators, expressed through various mathematical ratios, offer management and investors crucial insights into how the market perceives a company’s value, both currently and prospectively. These ratios analyze different aspects of a company’s financial health and growth potential, making them fundamental tools for investment decision-making and corporate assessment.

- Earnings Per Share (EPS): EPS measures the amount of a company’s profit allocated to each outstanding share of common stock, serving as an indicator of the company’s profitability. A higher EPS suggests that the company is more profitable, appealing to investors as it implies a greater yield on their investment.
- Book Value per Share: This ratio calculates a company’s net asset value allocated to each stock share. It is derived by dividing the company equity by the outstanding shares. This figure helps investors determine a company’s value compared to the market value of its shares, indicating potential overvaluation or undervaluation.
- Market Value per Share: The market value per share reflects the current trading price of the company’s stock, showing what the market believes a share of the company is worth. It results from the collective trading decisions of investors and traders in the stock market.
- Market/Book Ratio (M/B Ratio): The M/B ratio compares a company’s market value per share with its book value per share. A higher ratio indicates that the market values the company more highly than its book value, which could suggest investors’ confidence in its future growth prospects beyond its current assets.
- Price-Earnings (P/E) Ratio: This widely used metric evaluates a company’s current share price relative to its per-share earnings. A high P/E ratio could mean that the market expects significant earnings growth in the future. Conversely, a low P/E ratio might indicate that the stock is undervalued or the company is experiencing difficulties.
Each of these ratios provides a different perspective on the financial and market performance of a company:
- EPS focuses on profitability on a per-share basis, reflecting the company’s ability to generate earnings for its shareholders.
- Book Value per Share offers insight into the net asset value represented by each share, highlighting the company’s underlying equity.
- Market Value per Share captures the company’s current market sentiment and valuation, influenced by external market conditions and internal performance.
- Market/Book Ratio bridges the gap between the tangible book value of the company and the market’s valuation, indicating potential market expectations for growth or correction.
- The P/E Ratio balances the share price against earnings to gauge market expectations around future growth and profitability.
Please read the top 15 articles explaining share price:
How to find the price per share?
What Happens to Share Price After Buyback?
What makes a share price go up?
What causes share prices to drop?
How do you calculate the share average price?
How do you calculate the share price from the Balance Sheet?
Why do stock buybacks increase share price?
Do stock splits increase share price?
Does dividend reduce share price?
How does debt affect share price?
How does issuing new shares affect share price?
How to calculate the share price of a startup company?
What happens if a share price goes to zero?
Collectively, these ratios empower management and investors with a multifaceted understanding of a company’s market positioning, financial health, and potential investment attractiveness. They facilitate a nuanced analysis of how investors view the organization’s current status and prospects, enabling informed strategic decisions and investment choices.

He is an expert in financial niche, long-term trading, and weekly technical levels.
The primary field of Igor's research is the application of machine learning in algorithmic trading.
Education: Computer Engineering and Ph.D. in machine learning.
Igor regularly publishes trading-related videos on the Fxigor Youtube channel.
To contact Igor write on:
igor@forex.in.rs
