One of the most straightforward trading strategies I presented recently in my video on our YouTube channel:
Stock traders often employ sophisticated algorithms and analytical tools to scan and analyze thousands of stocks simultaneously. These tools enable them to identify rare and potentially profitable patterns that might be difficult to discern through manual analysis.


By leveraging these patterns, traders can develop simple yet effective strategies that capitalize on market inefficiencies or trends. This approach allows them to achieve higher profits with a streamlined, data-driven trading methodology.


One of them is a simple 80/20 RSI stocks trading strategy.
The strategy uses the Relative Strength Index (RSI), a popular momentum oscillator in technical analysis, to make buy and sell decisions based on specific threshold values. Here’s a detailed explanation of this strategy:
- Understanding RSI: The Relative Strength Index (RSI) is calculated based on a stock’s average gains and losses over a specific period, typically 14. It is displayed as a line graph that moves between two extremes, 0 and 100, and is used to identify overbought or oversold conditions in stock.
- The 80/20 Rule: In this strategy, an RSI value 80 is considered an overbought threshold, suggesting that the stock may be overvalued and be due for a reversal or pullback. Conversely, an RSI value of 20 is seen as an oversold threshold, indicating that the stock might be undervalued and could be poised for an upward correction.
- Buy and Sell Signals on Hourly and Daily Charts:
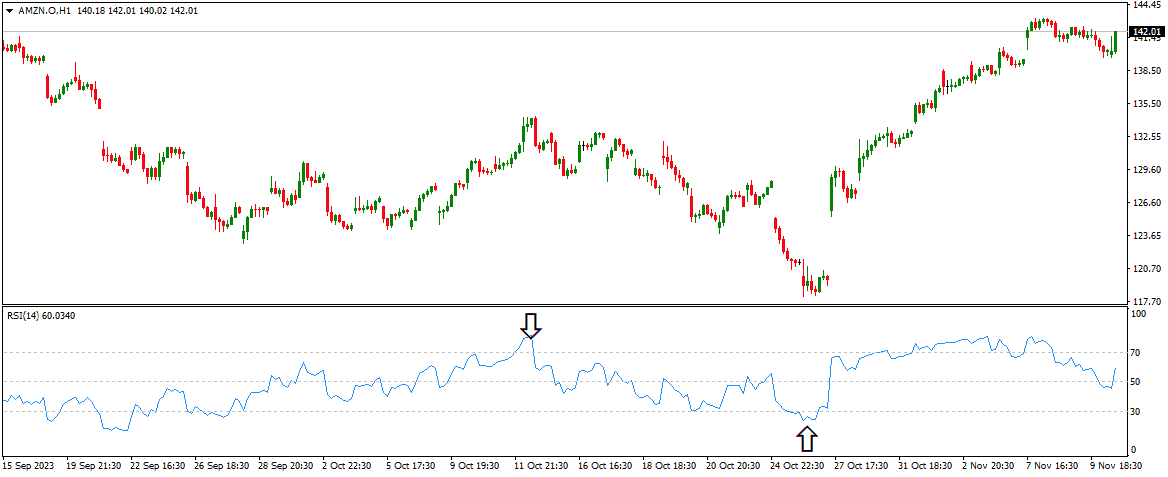
- Buying at RSI 20: Traders using this strategy would monitor the RSI on both the hourly and daily charts. When the RSI falls to 20 or below in either timeframe, it is seen as a potential buying opportunity, suggesting that the stock’s price has fallen too far and may rebound.
- Selling at RSI 80: Similarly, if the RSI reaches or exceeds 80, it could signal a selling opportunity. This suggests that the stock’s price might peak, and a downward correction or reversal could be imminent.
- Execution and Risk Management: Successful execution of this strategy requires consistent monitoring of the RSI on the chosen time frames. Traders must also implement sound risk management practices, such as setting stop-loss orders to protect against unforeseen market movements, as no strategy guarantees profit, and RSI signals can sometimes be misleading if used in isolation.
This strategy is popular among traders because of its simplicity and the widespread availability of RSI data. Still, like all trading strategies, it carries risk and should be part of a broader trading plan that includes diversification and a clear understanding of the market conditions.

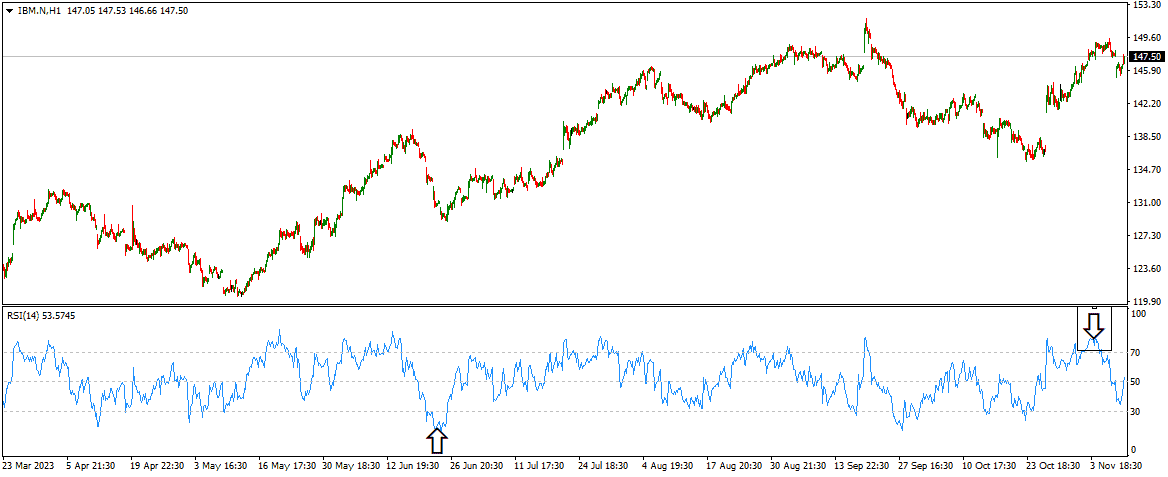
As we can see, on September 19, I didn’t trade on 20 RSI. I do not trade this strategy on opening range in the first 2-3 hours of trading.
From my experience with the 80/20 RSI strategy on hourly stock charts, I’ve learned that it’s most effective in the last few hours of the US market. I’ve observed that applying this strategy at the market opening can lead to more losing trades.
This is likely because the market opening is typically characterized by heightened volatility. In my trading practice, I’ve found that the RSI signals tend to be more reliable later in the day when the market has settled into a more consistent rhythm. Therefore, I prefer to focus on these later hours for implementing my 80/20 RSI trading strategy.
Daily 80-20 trading strategy
The daily 80-20 RSI strategy with the additional condition of consecutive bullish or bearish days is a more nuanced approach to trading based on technical analysis. Here’s a detailed explanation:
- RSI Thresholds on Daily Charts: This strategy still uses the Relative Strength Index (RSI) on a daily chart, where 80 signifies an overbought condition (potential sell signal), and 20 signifies an oversold condition (potential buy signal).
- Consecutive Bullish or Bearish Days: The additional condition you’ve incorporated requires the stock to have experienced three consecutive bullish (upward-moving) days before placing a buy order. Conversely, a sell order should have three consecutive bearish (downward-moving) days. This condition adds a layer of trend confirmation to the RSI signals, potentially increasing the reliability of the trading signals.
- Timing of Orders: In your strategy, orders are placed in the late evening of the third bullish or bearish day. This timing is crucial as it allows you to assess the entire day’s trading activity and ensures that the day qualifies as part of a consecutive bullish or bearish trend.
- Implementation: To implement this strategy, you would first monitor the daily RSI readings for the stocks of interest. If a stock’s RSI drops to 20 or below and there have been three consecutive days of price increases (bullish days), it might be considered a buy signal. Conversely, if the RSI rises to 80 or above following three consecutive days of price decreases (bearish days), it might be considered a sell signal.
- Risk Management and Considerations: Risk management is crucial in any trading strategy. Setting stop-loss orders and having a clear exit strategy can help mitigate losses. My stop loss is usually 1% or 1.5% for the stock price. It’s also important to consider that this strategy, while adding a layer of trend analysis, still relies heavily on technical indicators and might not account for all market conditions, such as unexpected news or economic events that can affect stock prices.
See Tesla example:
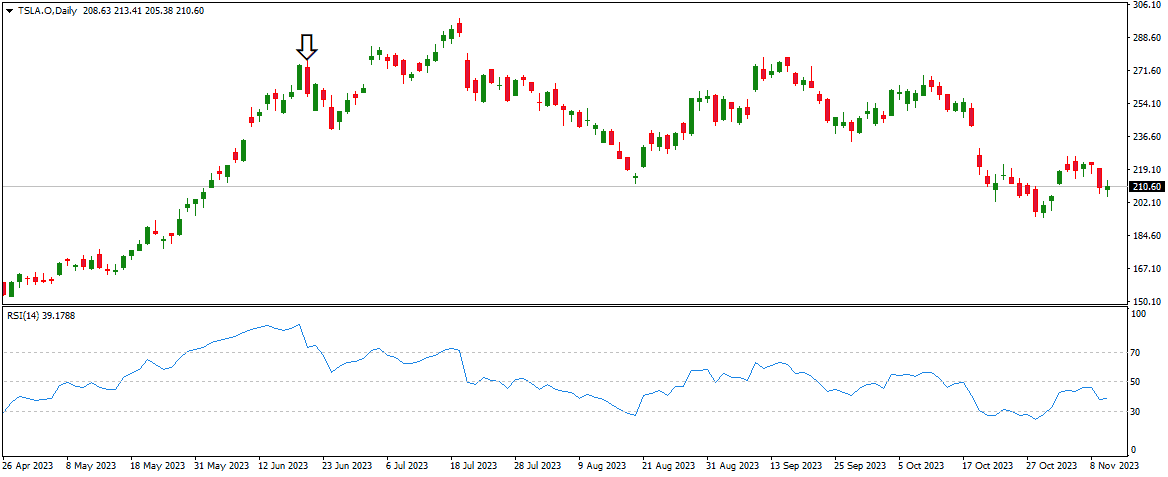
As you can see on the Daily chart, if I see the price on the third bullish day that reaches almost 80, I will make a sell order in late hours. I will wait until the next day open to see the bearish candle.
Conclusion
The 80/20 RSI strategy is a technical analysis tool used in stock trading that identifies potential buy and sell signals based on overbought (RSI above 80) and oversold (RSI below 20) conditions. Incorporating additional conditions, like requiring consecutive bullish or bearish days, can enhance its effectiveness by adding a layer of trend confirmation.
However, like all technical analysis methods, this strategy is not foolproof and should be used with other indicators and sound risk management practices. Ultimately, while it can be a valuable component of a trader’s toolkit, reliance solely on the 80/20 RSI strategy without considering broader market factors and volatility can lead to increased risk.

He is an expert in financial niche, long-term trading, and weekly technical levels.
The primary field of Igor's research is the application of machine learning in algorithmic trading.
Education: Computer Engineering and Ph.D. in machine learning.
Igor regularly publishes trading-related videos on the Fxigor Youtube channel.
To contact Igor write on:
igor@forex.in.rs
Related posts:
- What is Hedging in Forex? – Simple Currency Hedging Strategy!
- Forex Gap Trading Simple and Profitable
- What is Leveraged Buyout LBO in Simple Words
- Fibonacci Retracement Trading Strategy! – Golden Ratio Strategy!
- Can I Invest in Stocks at 16? Forex Trading Under 18!
- What is AI Trading Software? – Best AI Trading Software for Stocks
- Net Debt-to-EBITDA ratio in Simple Words
- Quality of Earnings Report! – QoE
- Pre IPO Stocks
- The Best 4h Trading Strategy
- Top Growth Stocks ASX
- What Does Barcoding Mean in Stocks?
