Table of Contents
One careful thought as to whether a skillful advice-giver can benefit forex trading boils down to employed money management. Regardless of how improved the logic is, it will fail if what is put into money management is inconsequent.
The challenge is that many traders lack knowledge of the true meaning of money management and harness it to one’s favor in self-functioning forex trading.
Position sizing methods can be analyzed in detail in our popular article.


Money care is used to strategically exploit position sizes in the diverse exchange of goods and services to be confident of positive output. With an effective fund care system, more losses and more wins are being accounted for, and they rise regularly with value rise.


Every skilled advice-giver gets more sequence of losses when they arrive, and the length of their existence is unknown. Also existing is a profitable sequence of winning. However, sequence losses empty one’s account, which can be worrisome. Instead, ensure you know the extent of your sequence losses (losing streaks) before setting up your inputs.
Download Money Management Expert Advisor
We tested several money management mql4 expert advisors. On the official Metatrader website mql5.com, we can find excellent forex money management EA such as:
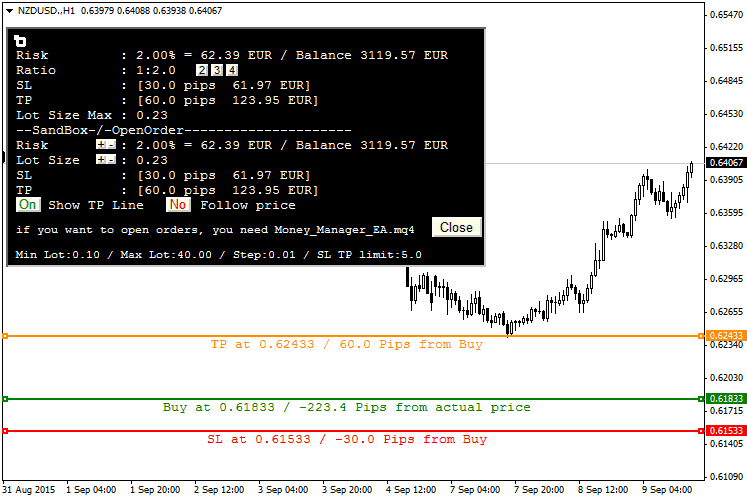
1) Money Manager Graphic Tool – indicator for MetaTrader 4

You will get an indicator and EA when you download the archive file.
The indicator is designed to help traders manage their risk and positions directly from the chart. Here’s a detailed breakdown of its functionality and critical components:
General Features:
- Indicator Type: It operates directly within the chart window (
#property indicator_chart_window), indicating that it graphically represents trading information and tools. - Version and Ownership: Version 1.03, with a link provided to MQL5, suggesting the place for updates or further information.
- User Inputs: The script allows several external inputs for customization:
- Buy and Sell activation keys (
BuyLine,SellLine) - Risk management parameters (
Risk,DefaultSLfor default stop-loss) - Colors and styles for different elements (buy/sell lines, SL/TP lines, etc.)
- Option to choose account type for calculations (balance or equity)
- Buy and Sell activation keys (
Functional Components:
- Graphical User Interface (GUI): The script dynamically creates a GUI within the chart using graphical objects like labels and buttons. This interface allows users to manipulate trading parameters such as lot size and risk percentage.
- Trading Helper Tools:
- Magic Number: This tool provides a unique identifier for trades opened using it, ensuring the EA (Expert Advisor) can manage these trades separately.
- Lot Size Calculation: Based on user-defined risk percentage and stop-loss settings.
- Price Levels: Users can set buy/sell levels and corresponding SL/TP levels via graphical lines drawn on the chart. The indicator calculates potential profit or loss and adjusts these levels accordingly.
Indicator Key Operations:
- Interactive Elements: The script includes interactive buttons to adjust risk and lot sizes on the fly, enhancing manual trading control. It also allows toggling TP/SL lines and moving them around to see real-time risk/reward changes.
- Event Handling: The indicator uses event handlers to manage changes made through the GUI, such as dragging price levels or clicking buttons to increase/decrease values.
- Risk and Trade Calculations: It provides real-time risk calculations based on the account balance/equity and the predefined risk percentage, which can be visually adjusted through the GUI.
Example Operations:
- When a user places a buy line on the chart, the script calculates the appropriate stop-loss and take-profit lines based on the input default values and risk settings. It also shows potential risk and reward amounts and adjusts the lot size to match the user’s risk preference.
- The tool provides sandbox features to experiment with different trading scenarios without executing them, such as adjusting SL/TP levels and seeing the corresponding risk/reward changes.
How does Money Management EA work?
The Money_Manager_EA.mq4 script is an Expert Advisor (EA) for MetaTrader 4 that works with the previously described Money_Manager_Graphic_Tool.mq4 indicator. This EA is designed to execute trades based on the parameters set by the graphical tool. Here’s a detailed explanation of how this EA functions:
Initialization and Deinitialization:
- OnInit() Function: When the EA starts, it sets a timer to trigger events every second (
EventSetTimer(1)) and sets a global variableMMGT_EAto1. This global variable likely signals other system parts (like the indicator) that the EA is active and operational. - OnDeinit() Function: This function is called when the EA is removed from the chart or MetaTrader is closed. It kills the timer (
EventKillTimer()) and resets theMMGT_EAglobal variable to0, indicating the EA is no longer active.
Trading Logic:
- OnTimer() Function: This is where the main trading logic occurs. It repeatedly checks for trading conditions based on global variables likely set by the graphical tool. Here’s the sequence of operations:
- Check for Action: It checks if the global variable
MMGT_<Symbol>_Actionis set to10, which might indicate a trigger to execute a trade. - Order Placement: If a trade needs to be executed, it attempts to place an order with parameters fetched from global variables such as:
- Trade type (buy/sell, market/limit/stop)
- Lot size
- Entry price
- Stop loss and take profit levels
- A unique magic number to identify trades managed by this EA
- Other order parameters like slippage, comment, and colors
- Error Handling: If the initial
OrderSendIf the call fails, it retries by specifying SL and TP directly in the order. If the order is successfully placed, it attempts to modify it with the specified SL and TP. Any failures generate alerts with specific error messages.
- Check for Action: It checks if the global variable
Error Management:
- Error text () Function: This function translates error codes from the MetaTrader trading environment into human-readable messages. It helps debug and understand why certain operations failed during the EA’s operation.
Interaction with the Graphical Tool:
- The EA closely interacts with the
Money_Manager_Graphic_Tool.mq4By reading and writing global variables that control trading actions. For instance, the graphical tool likely manages lot sizes, entry prices, and risk management parameters, which are then communicated to the EA via global variables. - When an action is completed, the EA updates the
MMGT_<Symbol>_Actionvariable to20, possibly indicating to the graphical tool or other system parts that the operation was successful.
Management Expert Advisor Types
- Fixed percentage
this is also referred to as the standard position sizing approach. In this approach, the trader determines the percentage level of the balance left in his account that can be risked in each transaction. Often, the value in percentage falls within 1% to 3%. Thus, the account’s magnitude depends on the percentage risk size.
For instance, if one transacts with $ 11,000, you might risk $1100 per transaction. Perhaps per transaction, the level of risk increases by one unit in percentage.
Hence, ending the transaction resulted in a loss of $1100. The main challenge of this approach is that the same quantity is apportioned to every exchange. Thereby, graphically, the account is smoother and more stable.
- Averaging up
This explains that the moment trades shift to gains, the merchant, as the price increases, also puts in more contracts. This is also called scaling into the exchange (trade)
The possible losing trades are minute because the formal point isn’t huge when accompanying the scaling into the trading method. The up-averaging process may be advantageous for the trend-following approach because it permits the trader to increase when the trend strengthens itself.
Inquiring to get a fair and appropriate price value to put into a position might cause a threat. In furtherance, the moment price shifts, those who gain can be annulled by the losers. To alter this effect immediately, transactions apply for more prominent positions in previous orders and diminish their magnitude when scaling into trade starts.
- Cost Averaging
This approach often causes controversy among traders. It is against averaging up because if one’s trade shifts in the opposite direction, it needs to make another order to increase your point.
Here, losses can be diminished, and the equal cost and income stage might be reached sooner as soon as a trade that shifted against you takes a new turn.
This approach is often misused by untrained traders, who are emotionally driven because they lose their spot. Such traders make new orders even when sloping down, hoping it will turn out in their favor—due to the lack of effective trading strategies, neglecting the fact that price must turn. The primary cause of significant losses among untrained traders is the lack of proper application of cost averaging. Hence, the approach is not meant for unskilled traders, is devoid of principles, and attaches emotion to trade.
- Martingale
This approach, like the averaging cost approach, is often discussed by traders. In the hope of recovering what was lost, the trader multiplies his position size by two. Together with the first winning transaction, this annuls the previous debt or losses.
The place where doubling-up depicts risking the entire account emerges unavoidably. Every merchant will taste a sequence of losses over a lengthy period, and just one is enough to empty the real trading account.
If merchants want to requite trade and start trade without suddenly losing after a series of losses, then the martingale approach becomes a significant issue; these conditions can wipe off the account sooner than expected. As statistics corroborate, losses can occur regardless of the trader’s expertise. Hence, it’s just a question before one completely explodes with this approach.
- Anti-Martingale
This approach removes the danger of the martingale approach. Using this method, the merchant doesn’t double up after a loss and employs an average risk level. As a result, a series of losses cannot quickly empty merchant accounts. In contrast, if a merchant has consecutive winnings, the merchant doubles up and takes more risk in the subsequent trade. In this method, the main idea is that trading is done with extra or, say, free money after the winning transactions.
For instance, a merchant earns $200 profit after risking 1% on a $10,000 account; he now has $10,200 as his new account. In the next transaction, he can risk 196% of $10,200, i.e., $200. If he wins, he gains $400, summing up his account to $10 600. In his subsequent trade, $600 can be risked to 57% of his previous account, i.e., $10 600.
Traders may gain more during consecutive winnings and never drop the initial account balance.
A loss can cancel the initial profits. Hence, merchants should be mindful of doubling up their stand. Instead, they should use a factor of less than 2 to determine their stand after a win. Doing this makes them a profit even after a series of losses.
Account shifts with the anti-martingale approach can be evident due to losses after consecutive wins, which can be huge if the subject cannot cope with them. This approach can result in other problems. Hence, a trader should have a predetermined level so that he doesn’t increase his position size further but returns to the original method to get his profits.
- Fixed ratio
This approach is predicated on trader profits. So, a trader must, of necessity, decide on a specific amount of gains that enable him to shoot up his delta. For instance, a trader may start trading a single contract and choose his increased position to be around $2,000. Each time a profit of $2,000 is realized by one contract, the position size increases.
The position size increases only if a profit is made. The extent of the increase in the trader’s equity is controlled by selecting delta. When this delta is high, it signifies the trader is at a lower position, and vice versa.
The value and setting of delta preference are not actual science but subjective.
The high delta reduces position size and a rising account. So, the account also rises with a low delta while the profit is unstable.
- Kelly’s Criterion
This approach aims to increase the combined return, which can be earned by reinvesting the interest. Loss and win rates are employed to decide the maximum position size.
Mathematically shown in the formula below:
Position size = Winrate – ( 1- Winrate / RRR)
However, the implied position size in this Kelly Criterion usually underestimates the effect of losses and consecutive losses.
Example from mql5.com :
Example:
Last 50 trades :
26 trades were positive ( profitable ) with a total gain of 780 pips
24 trades were negative, with a total loss of 600 pips
To get the Kelly ratio:
W = 26/50=0.52
R = (780/26)/ (600/24) =1.2
K% = W – [(1 – W) / R]
K% = 0.52- [(1 – 0.52) / 1.2]
K% = 12%
The goal is to compare various systems to see which system has the minor risk.
Conclusion
Gains and losses don’t usually occur in plane regularities but as consecutive wins and losses. I have found that this is inherent. Maintaining the line during reductions and moderately during successive wins is prudent.
Generally, effective risk control makes use of several fragments. There ought to be clarity, and the calculation of the possible losing streak and reduction of the system should be decided via estimation and backtesting. Also, there ought to be a clear choice of maximum risk of the network moving ahead because there’s no more than a 25% reduction. If the network’s history is gotten and there is a likely reduction, one can include a money management network that can self–manage the loss just to the extent that trade doesn’t go beyond the risk percentage. Also, the sequences of losses must not exceed the pre-decided tolerated ultimate risk.
To maintain your system for a long time, the transaction account’s size must not exceed the risk of 2%. The losing trade, on average, is too small compared to the end loss. Even if the minute risk percentage is due, more than ten consecutive losings may occur, which must be effortlessly survived if transacting with parallel systems. It is worth noting that one can run three strategies with a risk of 2% or six plans with a 1% risk each. However, it’s dangerous if the risk combines to rise above 10.
Furthermore, money management is like rendering the dragon- so far, you are sure of escaping its claws. Also, the fire coming out of its mouth is synonymous with manipulating oneself against a consecutive loss.
If you are careful with your strategies, you can escape risk and gallantly have more wins. However, you may lose your account if you allow greed to rule you and aim huge while setting your risk inputs.

He is an expert in financial niche, long-term trading, and weekly technical levels.
The primary field of Igor's research is the application of machine learning in algorithmic trading.
Education: Computer Engineering and Ph.D. in machine learning.
Igor regularly publishes trading-related videos on the Fxigor Youtube channel.
To contact Igor write on:
igor@forex.in.rs
