Table of Contents
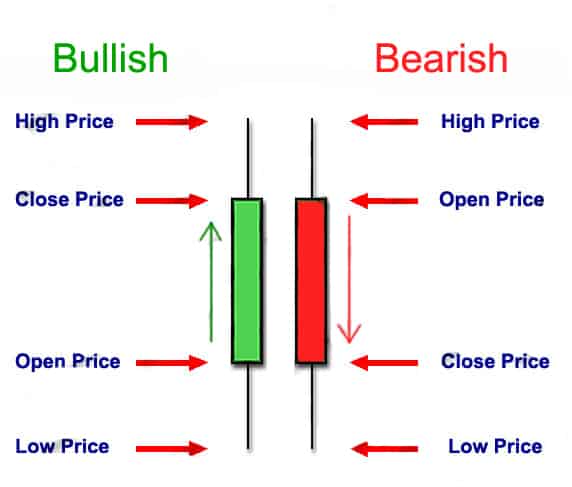
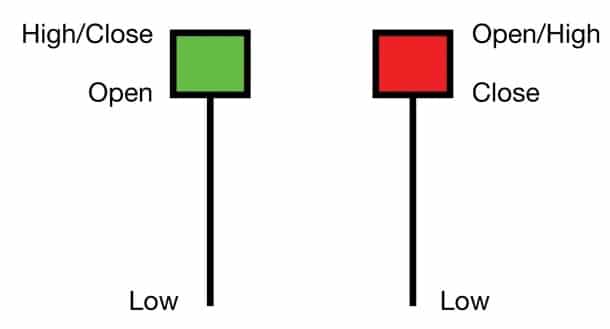
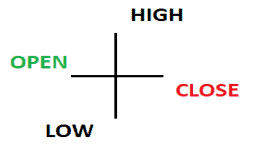
Candlestick patterns in trading are visual representations of price movements on a financial chart, primarily used in technical analysis. Each candlestick typically represents one time period, such as a day, and consists of a body and wicks or shadows. The candlestick’s body shows the opening and closing prices, while the wicks indicate the high and low prices during that period. Traders analyze these patterns to identify potential trends, reversals, or market sentiment. Common candlestick patterns include the Doji, Hammer, and Engulfing patterns, each conveying different information about market dynamics and potential future price movements.


Hammer Bullish Candlestick
The Hammer is a bullish candlestick pattern typically observed at the end of a downtrend. It consists of a small body at the top end of the trading range with a long lower wick resembling a hammer. This pattern suggests that despite selling pressure, buyers managed to push the price back up, indicating a potential reversal in sentiment. The long lower wick indicates the reversal’s extent and the buying interest’s strength. Traders often interpret the Hammer pattern as a signal to anticipate a bullish reversal, especially when confirmed by other technical indicators or occurring near crucial support levels.


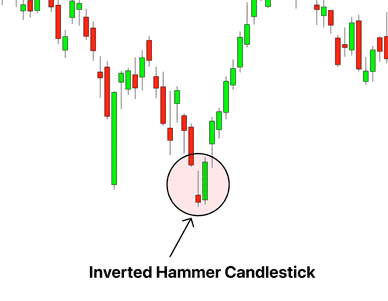
The Inverted Hammer Bullish Pattern
The Inverse Hammer is a candlestick pattern observed at the end of an uptrend, signaling a potential reversal. It resembles an upside-down hammer, featuring a small body near the bottom end of the trading range with a long upper wick. This formation suggests that despite initial buying pressure, sellers managed to push the price lower, indicating a possible shift in sentiment from bullish to bearish. Traders often use the Inverse Hammer as a warning sign that the uptrend may be losing momentum and that a bearish reversal could be imminent. It is particularly significant when it occurs near resistance levels or is confirmed by other technical indicators, such as overbought conditions or bearish divergence in oscillators.

The Piercing Line
The Piercing Line is a bullish candlestick pattern typically observed at the end of a downtrend, signaling a potential reversal. It consists of two candlesticks: the first is a significant bearish candle, followed by a second bullish candle that opens below the low of the first candle and closes at least halfway into the body of the first candle. The bullish candle essentially “pierces” through the bearish candle, suggesting a shift in market sentiment from bearish to bullish. Traders often interpret the Piercing Line pattern as a sign of impending bullish momentum, mainly when it occurs near support levels or is confirmed by other technical indicators.
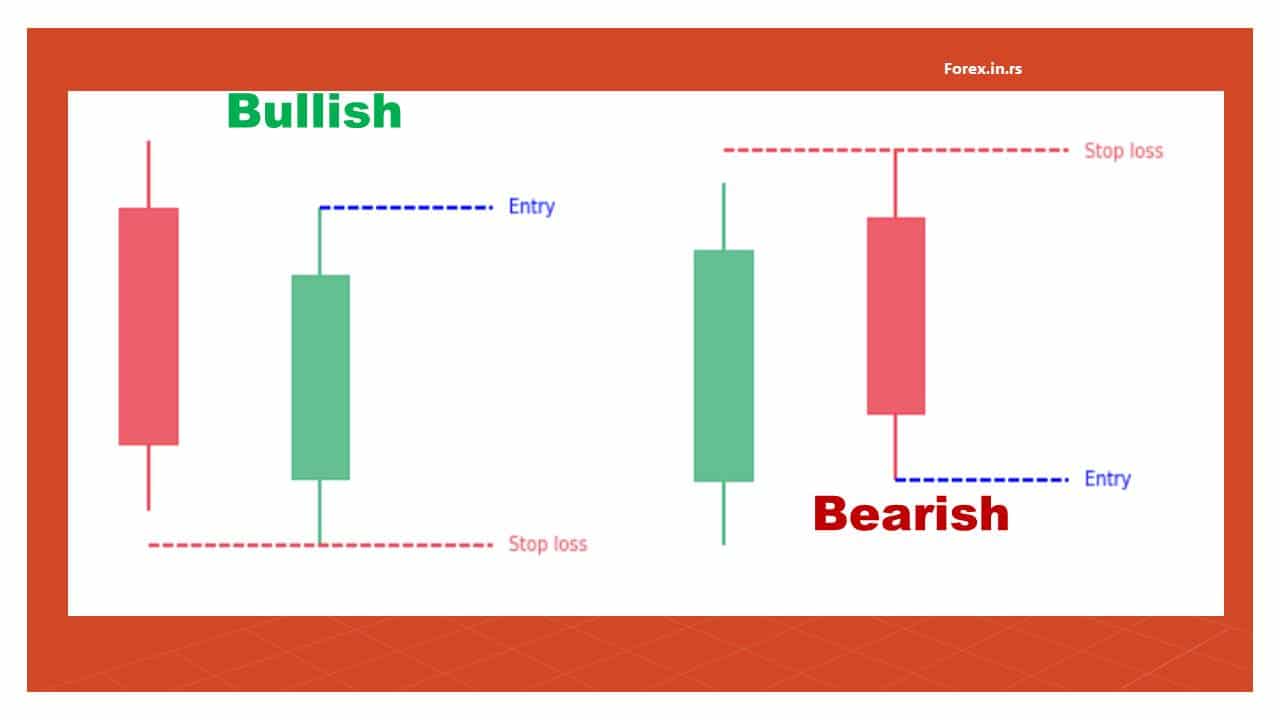
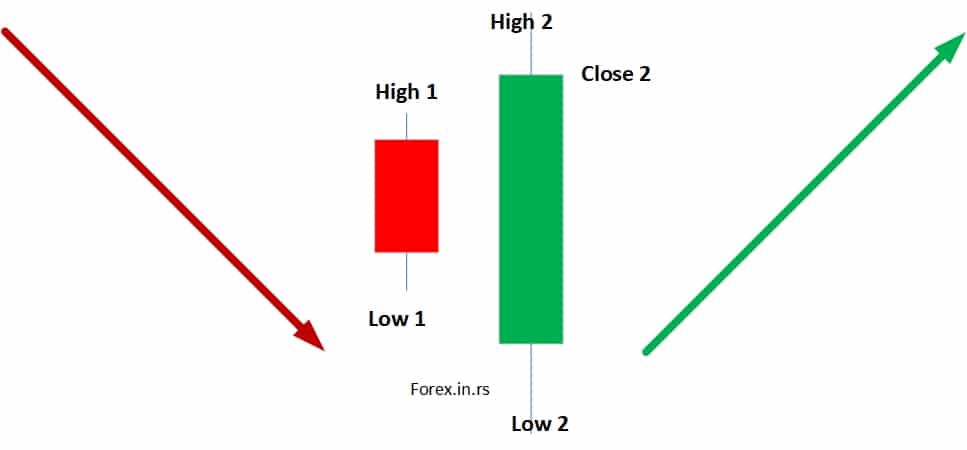
Bullish engulfing
The Bullish Engulfing candlestick pattern is a two-candle pattern that typically occurs during a downtrend, signaling a potential reversal of the downward movement. The first candlestick in the pattern is a smaller bearish candle, followed by a more significant bullish candle that completely engulfs the previous candle’s body. This means the second candle opens below the close of the first candle and closes above the opening of the first candle. The Bullish Engulfing pattern suggests a shift in market sentiment from bearish to bullish, as the buying pressure overwhelms the selling pressure. Traders often interpret this pattern as a signal to enter long positions or as confirmation of an existing bullish bias, mainly when it occurs near support levels or is backed by other technical indicators.
Morning Star Bullish Candlestick Pattern
The Morning Star is a bullish candlestick pattern that typically appears at the end of a downtrend, indicating a potential reversal in market sentiment. It consists of three candles:
- The first candle is a significant bearish candle, indicating intense selling pressure.
- The second candle is a small-bodied candle, known as a “doji” or a small bullish candle, which suggests indecision or decreased selling pressure.
- The third candle is a large bullish candle that closes above the midpoint of the first candle’s body, indicating a strong bullish momentum and potential reversal.
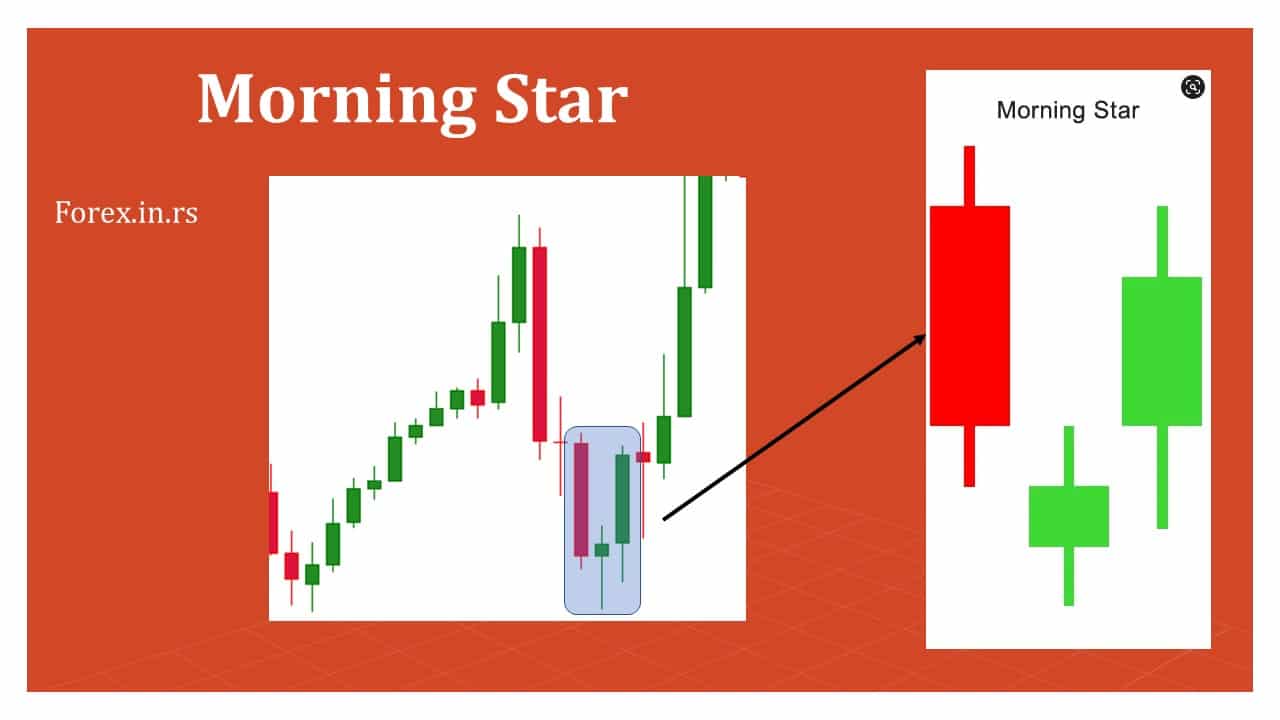
The Morning Star pattern signifies a shift from bearishness to bullishness, with the third candle confirming the reversal. Traders often interpret this pattern as a signal to enter long positions or as confirmation of an existing bullish bias, mainly when it occurs near support levels or is supported by other technical indicators.
Three white soldiers
The Three White Soldiers is a bullish candlestick pattern typically observed in a downtrend, signaling a potential reversal in market sentiment. It consists of three consecutive long bullish candles, each opening within the previous candle’s body and closing near its high. This pattern suggests increasing buying pressure and a solid upward momentum.
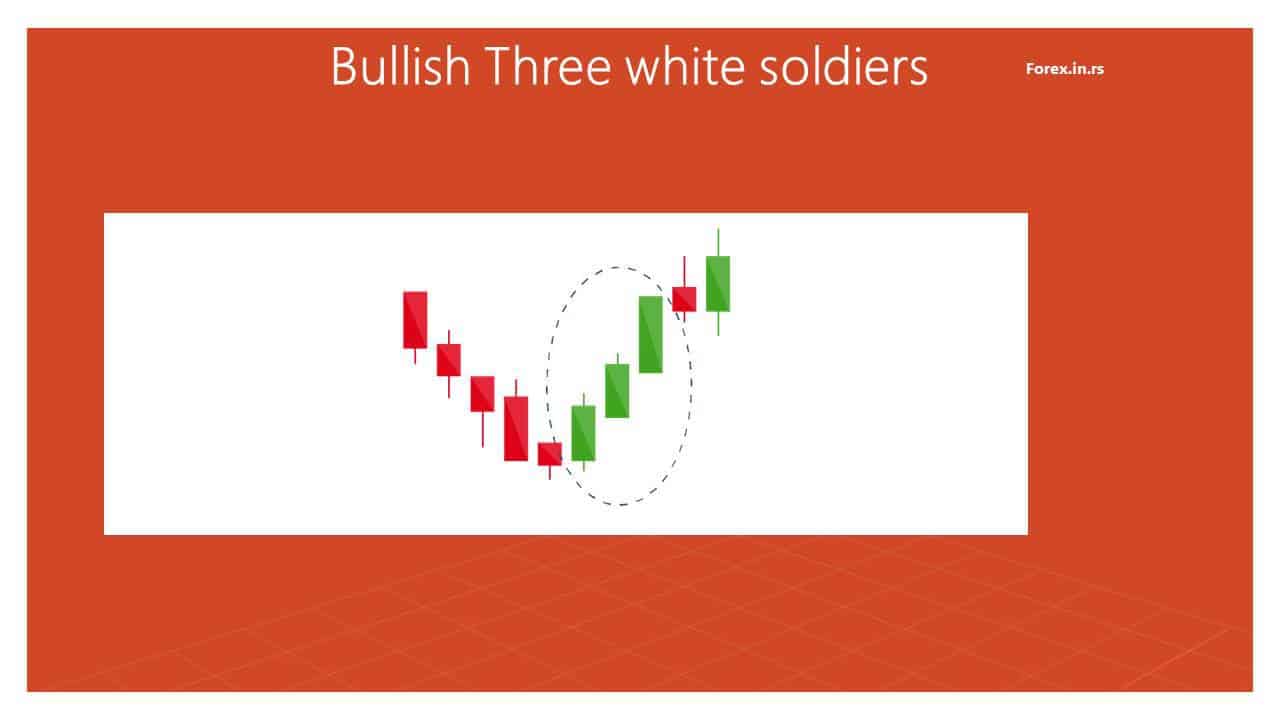
The consecutive appearance of three bullish candles indicates a clear shift from bearish to bullish sentiment. Traders often interpret the Three White Soldiers pattern as a signal to enter long positions or as confirmation of an existing bullish trend, mainly when it occurs with significant volume and is supported by other technical indicators.
Bearish Engulfing
The Bearish Engulfing pattern is a two-candlestick pattern that typically occurs at the end of an uptrend, signaling a potential reversal in market sentiment. It consists of:
- The first candlestick is a smaller, bullish candlestick.
- The second candlestick is a larger, bearish candlestick that completely engulfs, or “engulfs,” the body of the first candlestick. This means the second candle opens above the close of the first candle and closes below the opening of the first candle.
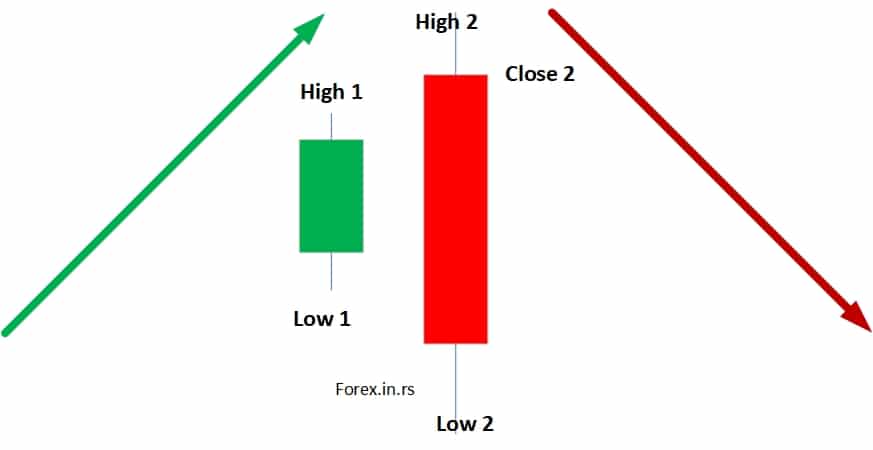
The Bearish Engulfing pattern suggests a shift from bullish to bearish sentiment, as the selling pressure overwhelms the buying pressure. Traders often interpret this pattern as a signal to enter short positions or as confirmation of an existing bearish bias, mainly when it occurs near resistance levels or is supported by other technical indicators.
Evening Star
The Evening Star is a bearish candlestick pattern that typically occurs at the end of an uptrend, signaling a potential reversal in market sentiment. It consists of three candlesticks:
- The first candlestick is a significant bullish candlestick, indicating intense buying pressure.
- The second candlestick is smaller-bodied, often a doji or a small bullish candlestick, indicating indecision or decreased buying pressure.
- The third candlestick is a significant bearish candlestick that closes below the midpoint of the first candlestick’s body, indicating a shift from bullish to bearish sentiment.
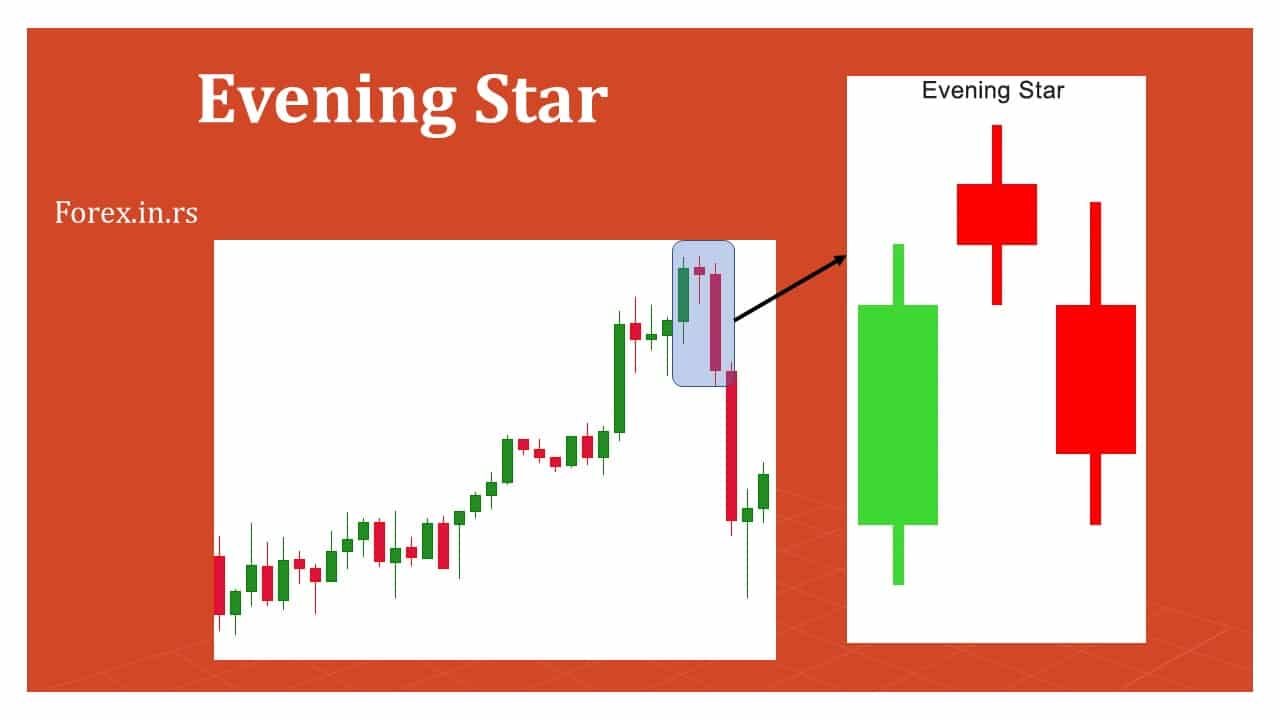
The Evening Star pattern signifies a transition from bullishness to bearishness, with the third candle confirming the reversal. Traders often interpret this pattern as a signal to enter short positions or as confirmation of an existing bearish trend, mainly when it occurs near resistance levels or is supported by other technical indicators.
Hanging man Bearish Candlestick Pattern
The Hanging Man is a bearish candlestick pattern that typically occurs at the end of an uptrend, signaling a potential reversal in market sentiment. It consists of a single candlestick with a small body near the top end of the trading range and a long lower shadow or wick. The upper shadow is relatively small or nonexistent. The appearance of the Hanging Man suggests that despite initial buying pressure, sellers managed to push the price lower, indicating a potential shift from bullish to bearish sentiment.
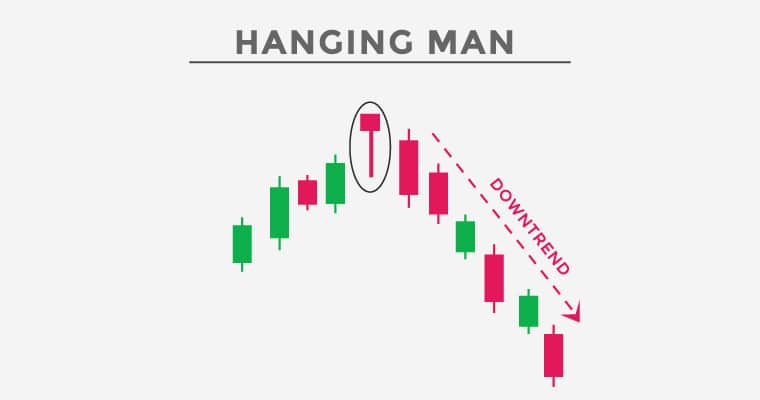
Traders often interpret the Hanging Man pattern as a warning sign of a potential trend reversal and may consider taking short positions or tightening stop-loss orders.
Shooting star Bearish Candlestick Pattern
The Shooting Star is a bearish candlestick pattern that typically occurs at the end of an uptrend, signaling a potential reversal in market sentiment. It consists of a single candlestick with a small body near the bottom end of the trading range and a long upper shadow or wick. The lower shadow is relatively small or nonexistent. The appearance of the Shooting Star suggests that despite initial buying pressure, sellers managed to push the price lower, indicating a potential shift from bullish to bearish sentiment.
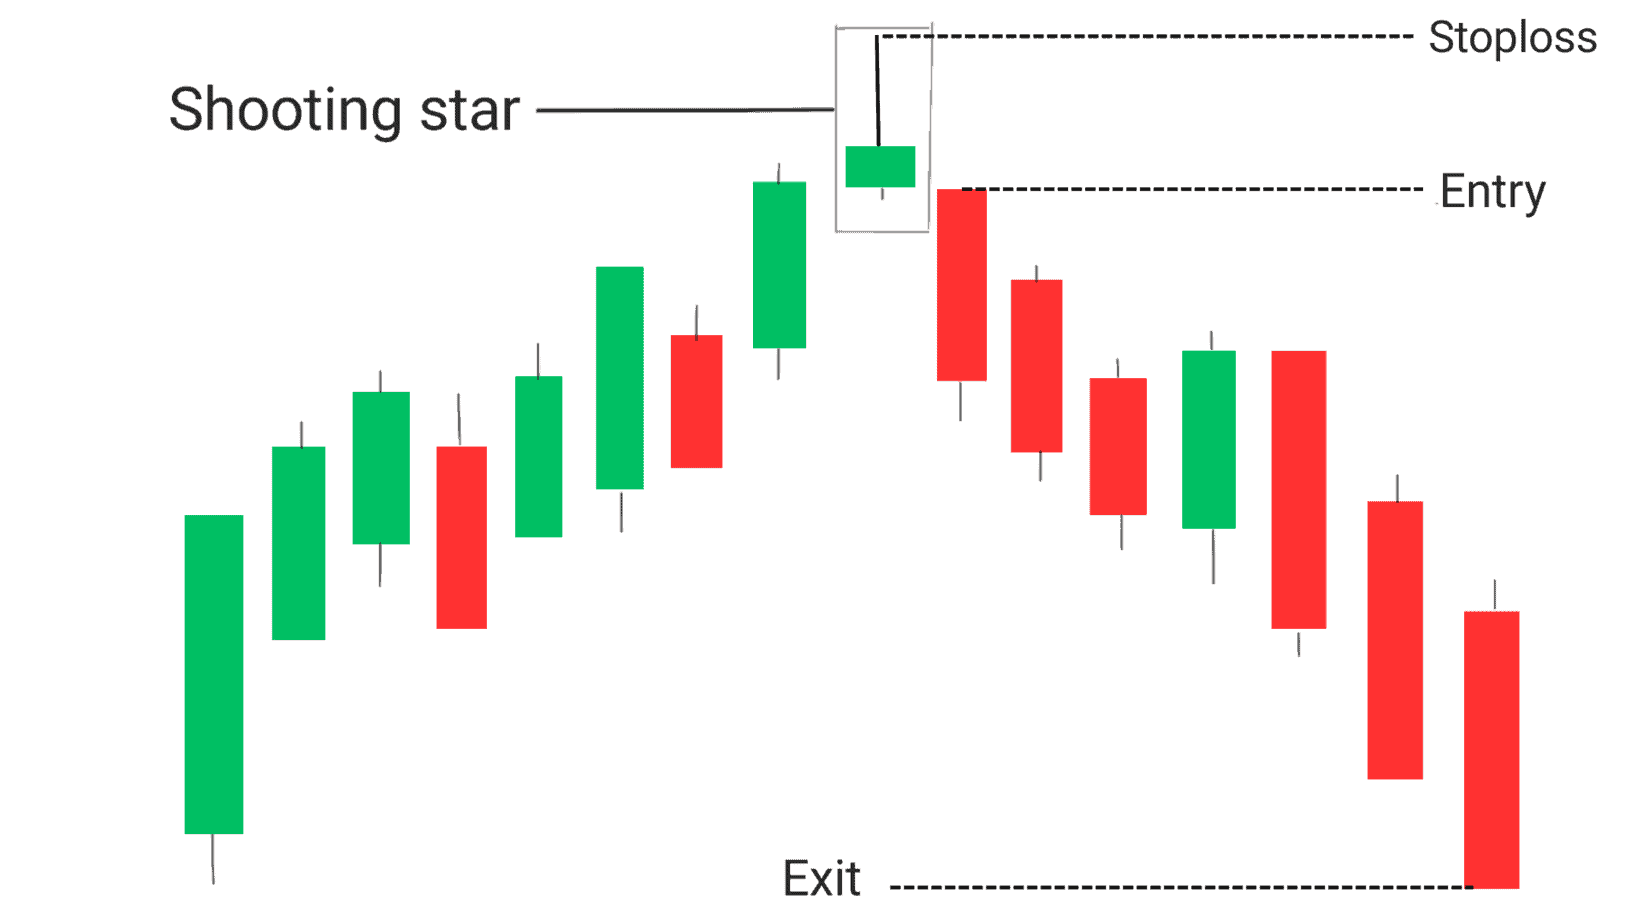
Traders often interpret the Shooting Star pattern as a warning sign of a potential trend reversal and may consider taking short positions or tightening stop-loss orders.
Three black crows Bearish Candlesticks Pattern
The Three Black Crows is a bearish candlestick pattern that typically occurs at the end of an uptrend, signaling a potential reversal in market sentiment. It consists of three consecutive long bearish candles, each opening within the previous candle’s body and closing near its low. This pattern suggests increasing selling pressure and a strong downward momentum.
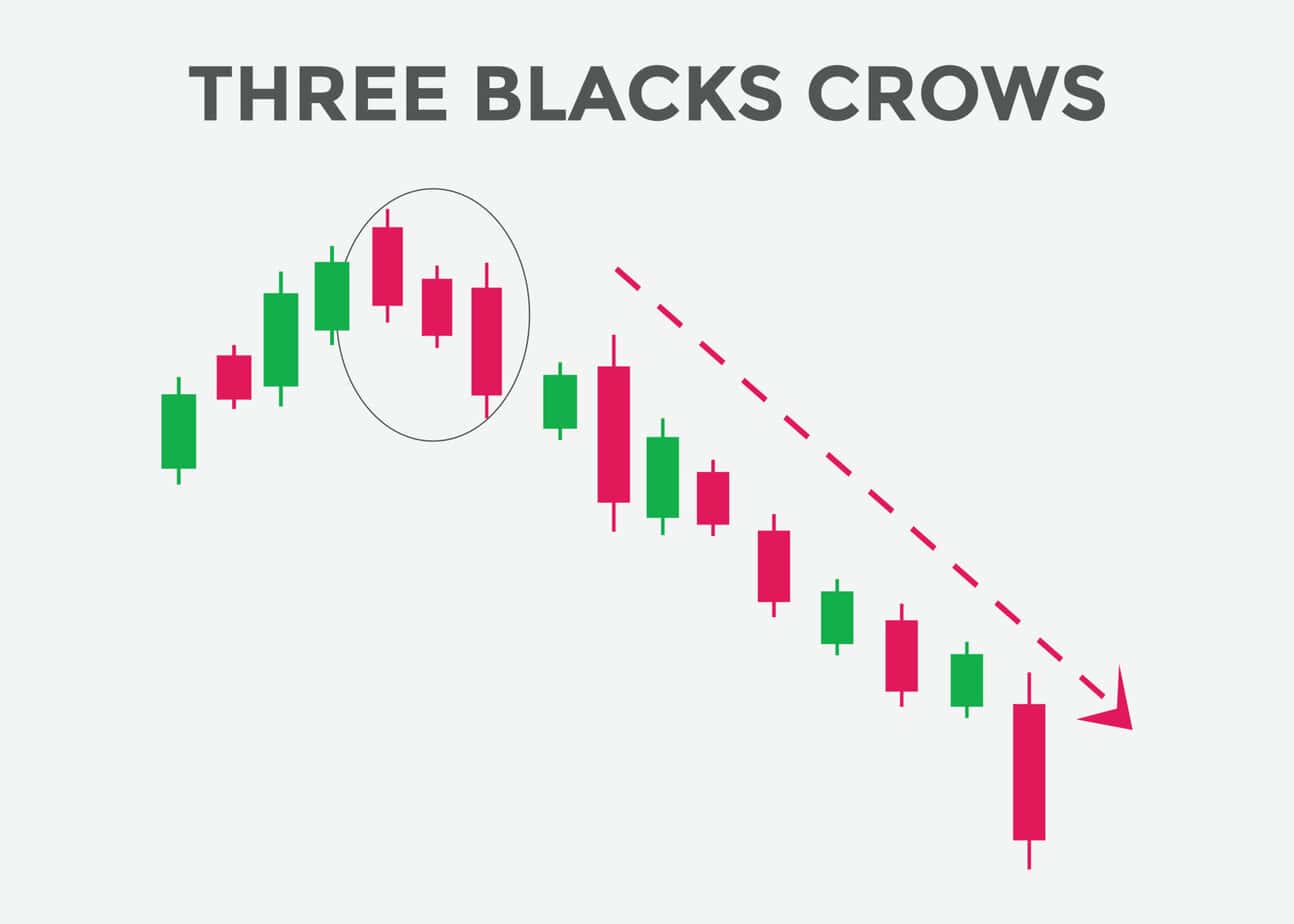
The consecutive appearance of three bearish candles indicates a clear shift from bullish to bearish sentiment. Traders often interpret the Three Black Crows pattern as a signal to enter short positions or as confirmation of an existing bearish trend, mainly when it occurs with significant volume and is supported by other technical indicators.
The Dark Cloud Cover
The Dark Cloud Cover is a bearish candlestick pattern that typically occurs at the end of an uptrend, signaling a potential reversal in market sentiment. It consists of two candlesticks:
- The first candlestick is a large bullish candlestick, indicating intense buying pressure.
- The second candlestick is a bearish candlestick that opens above the high of the first candlestick but closes below the midpoint of the first candlestick’s body. This candlestick essentially “clouds” the optimism of the first candle.
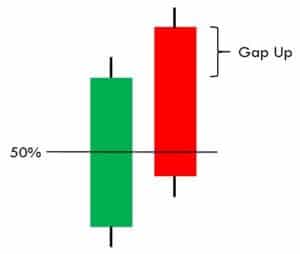
The Dark Cloud Cover pattern suggests a shift from bullish to bearish sentiment, with the second candlestick indicating that selling pressure is overcoming buying pressure. Traders often interpret this pattern as a signal to consider short positions or as confirmation of an existing bearish trend, mainly when it occurs near resistance levels or is supported by other technical indicators.
Doji
A Doji is a single candlestick pattern that typically occurs when an asset’s opening and closing prices are very close to each other, resulting in a small or nearly nonexistent body. This candlestick pattern signifies indecision and a balance between buying and selling pressure in the market. Visually, a Doji resembles a cross, a plus sign, or a small horizontal line.
Doji patterns can take various forms, such as the classic, Long-Legged, Gravestone, and Dragonfly, each with slight variations in appearance and implications. Traders often interpret the appearance of a Doji as a potential reversal signal or a point of market equilibrium, mainly after a significant price movement or near support or resistance levels.
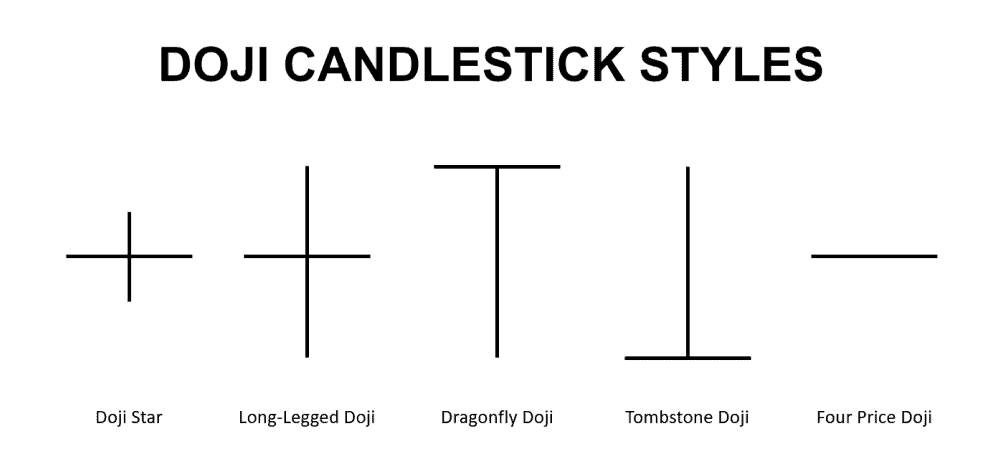
However, Doji patterns are typically more meaningful when they appear within a broader context of market conditions and are confirmed by other technical indicators or candlestick patterns.
Spinning top
The Spinning Top is a single candlestick pattern that typically occurs when an asset’s opening and closing prices are very close to each other, resulting in a small body. However, unlike the Doji pattern, a Spinning Top has noticeable upper and lower wicks or shadows, indicating significant price movement during the trading period.
This candlestick pattern reflects indecision in the market, with buyers and sellers exerting pressure but neither gaining complete control. Visually, a Spinning Top resembles a small vertical line with relatively long upper and lower wicks. Traders often interpret the appearance of a Spinning Top as a sign of potential reversal or a pause in the prevailing trend, mainly after a significant price movement or near support or resistance levels. However, it’s essential to consider the broader context of market conditions and use additional technical analysis tools to confirm any potential signals the Spinning Top pattern provides.

He is an expert in financial niche, long-term trading, and weekly technical levels.
The primary field of Igor's research is the application of machine learning in algorithmic trading.
Education: Computer Engineering and Ph.D. in machine learning.
Igor regularly publishes trading-related videos on the Fxigor Youtube channel.
To contact Igor write on:
igor@forex.in.rs
