Table of Contents
Channels are lines that define the upper resistance and the lower support levels in a Forex chart. Traders often use these lines to identify when an asset price is overbought or oversold. As such, the channel indicator is used to help traders identify potential entry and exit points in the market.


When applying the channel indicator to a forex chart, it is usually plotted along with the price chart. This lets traders see how the channel changes in response to the asset’s price movement. In essence, channels help traders to filter out unnecessary noise on the chart and focus on the bigger picture.


Furthermore, channels can also help traders identify the strength of a trend. When the channel is steep, and the price stays within its boundaries, it suggests a strong trend direction. On the other hand, a shallow or narrow channel usually indicates a weak trend direction.


What is Keltner Channel?
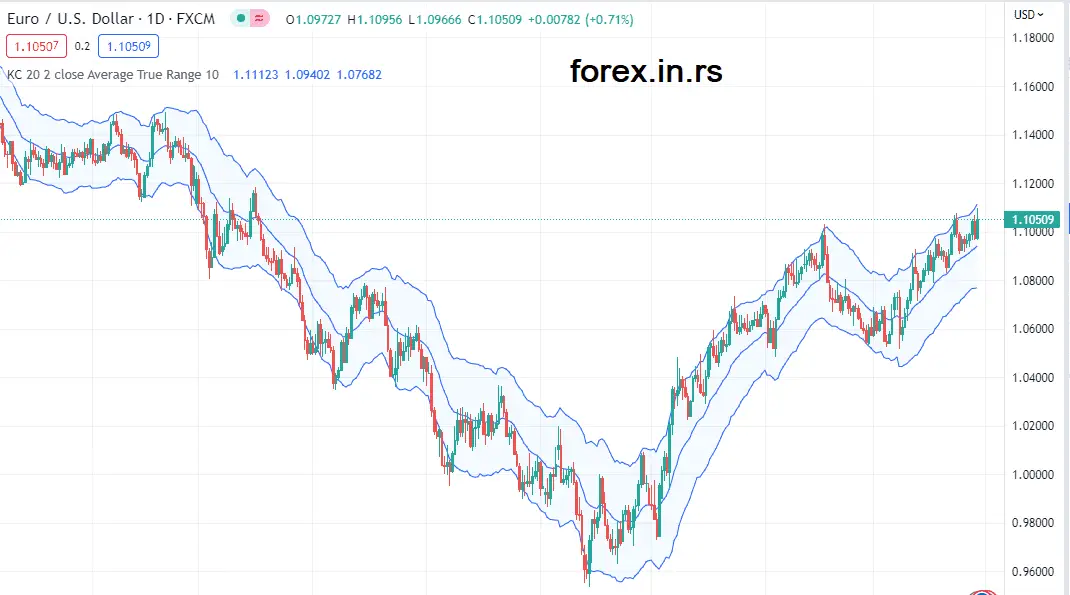
Keltner channel represents a technical indicator that places three lines plotted on a price chart. The middle line is typically a 20-period exponential moving average (EMA) of the closing price. The upper and lower lines are drawn at a fixed distance from the middle line based on the price’s average true range (ATR) over a specified period. The ATR is a measure of volatility that considers the range of price movements over a specified period.
In the presented video, we will analyze the Keltner trading channel strategy for several currency pairs and cryptocurrencies in 50 years testing period on the TradingView platform:
The Keltner Channel is a technical analysis indicator used in financial markets, including the Forex market, to help identify potential trend reversals, breakouts, and trading opportunities. It was developed by Chester Keltner in the 1960s and is based on the principles of volatility and moving averages.
The upper line is typically set two times the ATR above the middle line, while the lower line is set two times the ATR below the middle line. However, traders can adjust the settings to suit their trading style and the market conditions being analyzed.
The Keltner Channel can be used in various ways, including to identify potential trend reversals when prices move outside the channel or to identify potential breakout opportunities when prices move above or below the channel. The indicator can be used on its own or with other technical indicators to form a complete trading strategy.
Keltner Channel Formula
The Keltner Channel indicator is based on three lines that are calculated as follows:
- Middle Line: The middle line is the 20-period exponential moving average (EMA) of the closing price.
- Upper Line: The upper line is calculated by adding a multiple of the average true range (ATR) to the middle line. The ATR is a measure of volatility that considers the range of price movements over a specified period. The standard deviation of the ATR is often used as the multiplier, with a common value being 2.
Upper line = Middle line + (Multiplier x ATR)
- Lower Line: The lower line is calculated by subtracting a multiple of the ATR from the middle line.
Lower line = Middle line – (Multiplier x ATR)
The ATR period and multiplier’s value can be adjusted based on the trader’s preferences and the analyzed market conditions. By using the ATR, the Keltner Channel adjusts dynamically to changes in volatility, which can help traders identify potential trend reversals or breakouts.
The Keltner Channel Strategy is a popular trading strategy used in Forex and other financial markets. The strategy is based on the Keltner Channel, a technical indicator consisting of three lines plotted on a price chart.
The middle line is typically a 20-period Exponential Moving Average (EMA). In contrast, the upper and lower lines are drawn a fixed distance away from the middle line based on the Average True Range (ATR) of the price over a specified period.
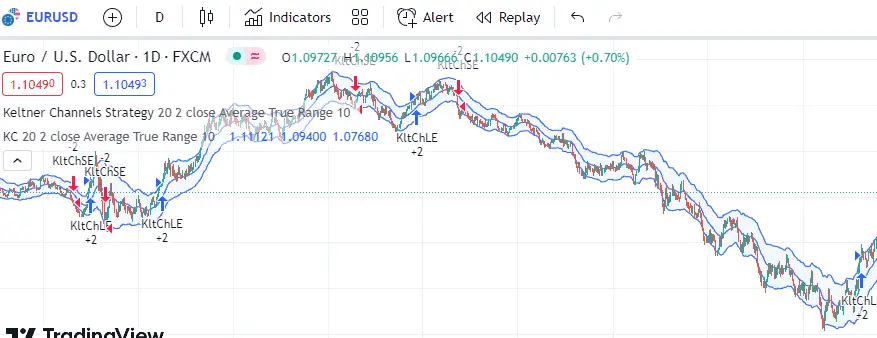
To use the Keltner Channel Strategy, traders typically look for price action that moves outside the channel, indicating a potential trend reversal. A long position may be taken if the price breaks above the upper channel line, while a short position may be taken if the price breaks below the lower channel line.
Traders may also use other technical indicators, such as oscillators or trend lines, to confirm signals generated by the Keltner Channel.
It’s important to note that the Keltner Channel Strategy is just one tool in a trader’s toolbox and should be used with other technical analysis techniques and risk management strategies. As with any trading strategy, there is no guarantee of success, and traders should always be prepared to manage risk and cut losses if the market moves against them.
What is Keltner Channel Strategy?
The Keltner channel Strategy represents a strategy where a long position may be taken if the price breaks above the upper channel line. In contrast, a short position may be taken if the price breaks below the lower channel line.
In addition to the Keltner Channel, traders may use other technical indicators, such as oscillators or trend lines, to confirm signals the channel generates. It is important to note that the Keltner Channel Strategy is just one tool in a trader’s toolbox and should be used with other technical analysis techniques and risk management strategies.
As with any trading strategy, there is no guarantee of success, and traders should always be prepared to manage risk and cut losses if the market moves against them. Traders should also consider market conditions, trading timeframes, and risk tolerance when using the Keltner Channel or any other trading strategy.
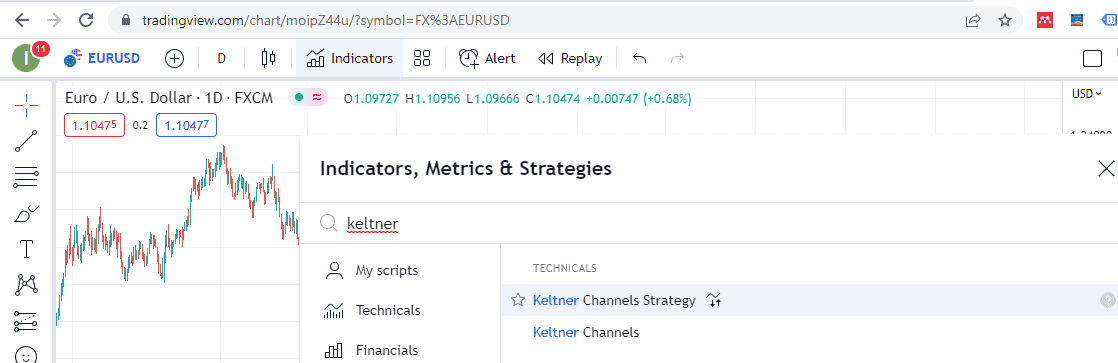
To activate the Keltner channel strategy, type “Indicators, Metrics & strategies” and “Keltner.” Choose Keltner channel strategy:
Let us see a few examples:
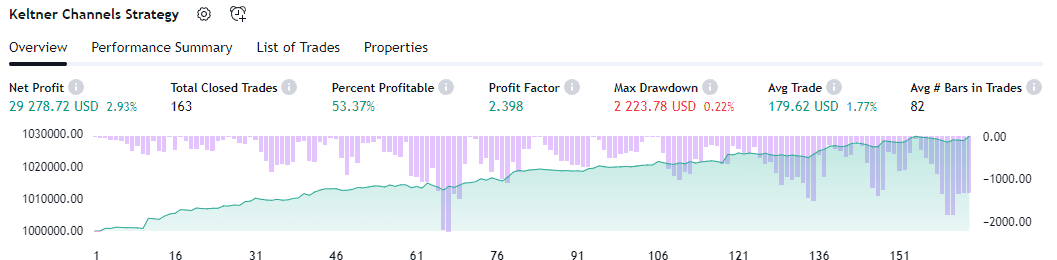
Below is the presented EURUSD Keltner channel strategy for the last 50 testing periods with a 2.398 Profit factor:
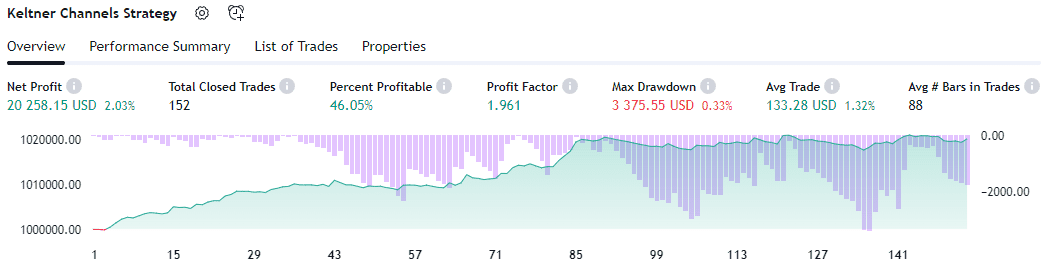
Below is the presented GBPUSD Keltner channel strategy for the last 50 testing periods with a 1.961 Profit factor:
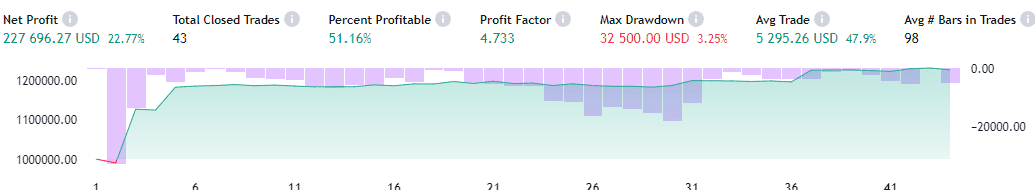
Below is the presented bitcoin Keltner channel strategy for the last 50 testing periods with a 4.733 Profit factor:
What is the best setting for the Keltner Channels?
The best settings for the Keltner Channels are EMA 20 for the middle line and 2 multiplies of ATR (14) for the upper and lower channel lines. On the daily chart, Keltner Channels for 20 EMA and 2 multiplies ATR can bring from 2 to 5 Profit factors for major forex pairs in 50 years testing period.
Conclusion
The Keltner Channel Strategy is just one tool in a trader’s toolbox and should be used with other technical analysis techniques and risk management strategies. While the strategy can effectively identify potential trading opportunities, there is no guarantee of success. Traders should always be prepared to manage risk and cut losses if the market moves against them.
Traders should also consider factors such as market conditions, trading timeframes, and risk tolerance when using the Keltner Channel Strategy or any other trading strategy. By combining the Keltner Channel with other technical indicators and risk management techniques, traders can develop a comprehensive trading plan that can help them achieve their trading goals over the long term.

He is an expert in financial niche, long-term trading, and weekly technical levels.
The primary field of Igor's research is the application of machine learning in algorithmic trading.
Education: Computer Engineering and Ph.D. in machine learning.
Igor regularly publishes trading-related videos on the Fxigor Youtube channel.
To contact Igor write on:
igor@forex.in.rs
