Current wheat price


Below you can download 43 years of Historical Wheat Prices data.


How many pounds in a bushel of wheat?
There are 60 pounds in 1 bushel of wheat or 27.216 kg.


Wheat has been a staple of the human diet for centuries and is one of the most widely used crops in the world. It has been an essential part of many economies, and its price has fluctuated over time. This article will look at the historical wheat prices per bushel and how prices have changed over the years.
In the United States, wheat is measured in bushels, units of volume equal to 32 quarts. Before 1960, wheat was primarily traded through cash markets, with prices depending on local production and demand. This created wide variations between regions and led to local surpluses or shortages. As transportation technology improved, it was easier for commodities to be transferred between states or even across countries. This made it possible to establish more uniform prices throughout different regions, leading to an increasing trend in wheat prices over time.
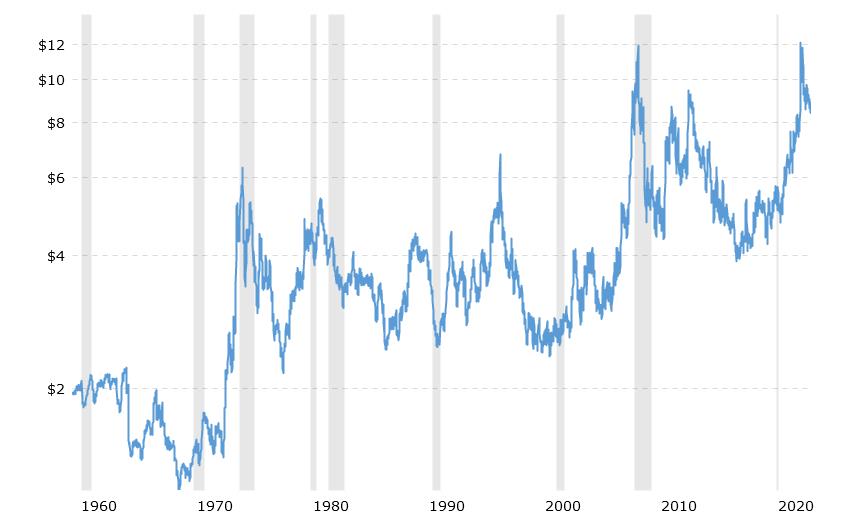
The first significant spike in U.S. wheat prices came during World War II when food shortages resulted in higher costs for grain commodities across Europe and America. This caused an increase in wheat price per bushel from around 30 cents before the war to 68 cents by 1945. After World War II, several fluctuations with smaller spikes occurred due to drought conditions, such as those experienced during the mid-1960s and early 1970s. By 1975, wheat had reached $2 per bushel following two years of drought-related supply shocks that sent global commodity prices skyrocketing.
During this period, farmers began switching from other cereal crops, such as corn and soybeans, to growing more wheat since it commanded higher prices than other grains. This led to increased production levels but also caused concern among buyers that supply would outstrip demand, causing a crash in prices similar to what occurred after World War II during the 1950s when there was an excess of grain available on the market that drove down its value significantly.
However, this situation never materialized as solid export demand kept up with rising domestic supplies, thus preventing any significant price drops from occurring over time until recently when historically low harvest yields combined with reduced foreign demand had put pressure on U.S.-grown grain, resulting in lower prices than what had been seen for decades prior hitting as little as $4 per bushel in 2016 which is approximately half of what it was back at its peak during 1975-76 season when it reached almost $8 per bushel on average nationwide.
It is uncertain what will happen next concerning wheat pricing within America. Still, one thing is sure – those who are engaged in agricultural activities will need to be prepared for whatever happens moving forward so they can take advantage of potential opportunities while minimizing the risk associated with volatile markets like these involving food commodities such as grains, wheat which are essential not just for human consumption but also livestock feed requirements worldwide making its future dynamics something worth keeping close track off regardless if you are involved selling or buying them directly or else downstream products relying upon them being available at reasonable cost levels near term ahead.
How many kg in a bushel of wheat?
There is 27.216kg in 1 bushel of wheat.
Below are presented wheat historically yearly prices:
| Year | Wheat Average closing price | Year Open | Year High | Year Low | Year Close | Annual percentage change |
|---|---|---|---|---|---|---|
| 2021 | $6.6258 | $6.4200 | $7.6175 | $6.0175 | $6.2225 | -2.85% |
| 2020 | $5.4980 | $5.6025 | $6.4075 | $4.7470 | $6.4050 | 14.63% |
| 2019 | $4.9414 | $5.0675 | $5.5875 | $4.2475 | $5.5875 | 11.03% |
| 2018 | $4.9757 | $4.3350 | $5.7450 | $4.1650 | $5.0325 | 17.86% |
| 2017 | $4.4014 | $4.0650 | $5.6000 | $4.0225 | $4.2700 | 4.66% |
| 2016 | $4.3945 | $4.5825 | $5.1950 | $3.8065 | $4.0800 | -13.19% |
| 2015 | $5.0836 | $5.8150 | $6.1555 | $4.6525 | $4.7000 | -20.27% |
| 2014 | $5.8908 | $5.9700 | $7.3900 | $4.7400 | $5.8950 | -2.60% |
| 2013 | $6.8608 | $7.5525 | $7.9125 | $6.0050 | $6.0525 | -22.20% |
| 2012 | $7.5412 | $6.5700 | $9.4325 | $5.9225 | $7.7800 | 19.19% |
| 2011 | $7.1443 | $8.0550 | $8.8600 | $5.7740 | $6.5275 | -17.82% |
| 2010 | $5.8712 | $5.5775 | $7.9925 | $4.2800 | $7.9425 | 46.68% |
| 2009 | $5.3381 | $6.1100 | $6.7450 | $4.4125 | $5.4150 | -11.34% |
| 2008 | $7.9908 | $9.1500 | $12.8250 | $4.7550 | $6.1075 | -30.99% |
| 2007 | $6.4086 | $5.0100 | $9.7950 | $4.1900 | $8.8500 | 76.65% |
| 2006 | $4.0607 | $3.4600 | $5.4250 | $3.2250 | $5.0100 | 47.68% |
| 2005 | $3.2152 | $3.0225 | $3.6800 | $2.8775 | $3.3925 | 10.33% |
| 2004 | $3.4785 | $4.0575 | $4.2275 | $2.9510 | $3.0750 | -18.44% |
| 2003 | $3.3615 | $3.2875 | $4.1475 | $2.7925 | $3.7700 | 16.00% |
| 2002 | $3.2541 | $2.9200 | $4.2200 | $2.6125 | $3.2500 | 12.46% |
| 2001 | $2.7417 | $2.7625 | $2.9550 | $2.4575 | $2.8900 | 3.40% |
| 2000 | $2.6053 | $2.4750 | $2.8425 | $2.3350 | $2.7950 | 12.47% |
| 1999 | $2.6215 | $2.7900 | $2.9425 | $2.3775 | $2.4850 | -10.05% |
| 1998 | $2.9395 | $3.3075 | $3.4800 | $2.4675 | $2.7625 | -15.20% |
| 1997 | $3.6793 | $3.8925 | $4.4175 | $3.2175 | $3.2575 | -14.56% |
| 1996 | $4.7452 | $5.0850 | $6.8290 | $3.6875 | $3.8125 | -25.57% |
| 1995 | $4.2164 | $3.9550 | $5.1225 | $3.4150 | $5.1225 | 27.58% |
| 1994 | $3.5871 | $3.7275 | $4.1625 | $3.1350 | $4.0150 | 6.15% |
| 1993 | $3.3035 | $3.6125 | $3.9250 | $2.7750 | $3.7825 | 6.93% |
| 1992 | $3.6521 | $4.0075 | $4.5950 | $3.0575 | $3.5375 | -12.60% |
| 1991 | $3.0476 | $2.6350 | $4.0575 | $2.4625 | $4.0475 | 55.37% |
| 1990 | $3.1868 | $4.0875 | $4.1000 | $2.4350 | $2.6050 | -36.35% |
| 1989 | $4.0967 | $4.3925 | $4.4875 | $3.8175 | $4.0925 | -6.99% |
| 1988 | $3.7030 | $3.1425 | $4.4050 | $2.9775 | $4.4000 | 41.59% |
| 1987 | $2.8537 | $2.7300 | $3.2100 | $2.5675 | $3.1075 | 13.21% |
| 1986 | $2.8086 | $3.3950 | $3.3950 | $2.4050 | $2.7450 | -20.03% |
| 1985 | $3.2565 | $3.4625 | $3.7075 | $2.7475 | $3.4325 | -1.29% |
| 1984 | $3.5086 | $3.5400 | $3.7725 | $3.2175 | $3.4775 | -4.33% |
| 1983 | $3.5670 | $3.2425 | $4.0775 | $3.1845 | $3.6350 | 9.90% |
| 1982 | $3.5092 | $3.9075 | $4.0200 | $3.0175 | $3.3075 | -15.52% |
| 1981 | $4.2817 | $5.0850 | $5.0850 | $3.7625 | $3.9150 | -21.86% |
| 1980 | $4.5690 | $4.4550 | $5.4150 | $3.8050 | $5.0100 | 10.29% |
| 1979 | $4.0198 | $3.4075 | $4.8375 | $3.3225 | $4.5425 | 32.34% |
| 1978 | $3.1801 | $2.7500 | $3.7500 | $2.5820 | $3.4325 | 22.92% |
| 1977 | $2.5765 | $2.7450 | $2.8835 | $2.1475 | $2.7925 | 0.63% |
| 1976 | $3.3263 | $3.3800 | $3.9975 | $2.5575 | $2.7750 | -17.35% |
| 1975 | $3.6960 | $4.5775 | $4.5775 | $2.9575 | $3.3575 | -26.77% |
| 1974 | $4.7135 | $5.5450 | $6.3360 | $3.3600 | $4.5850 | -15.87% |
| 1973 | $3.4883 | $2.5925 | $5.4500 | $2.1475 | $5.4500 | 106.44% |
| 1972 | $1.8039 | $1.6188 | $2.6950 | $1.4013 | $2.6400 | 61.83% |
| 1971 | $1.5757 | $1.6788 | $1.7250 | $1.4150 | $1.6313 | -3.19% |
| 1970 | $1.5341 | $1.4538 | $1.7900 | $1.3450 | $1.6850 | 14.33% |
| 1969 | $1.3286 | $1.3525 | $1.4800 | $1.2125 | $1.4738 | 8.77% |
| 1968 | $1.3451 | $1.4620 | $1.5460 | $1.1710 | $1.3550 | -8.26% |
| 1967 | $1.5998 | $1.7440 | $1.8700 | $1.4330 | $1.4770 | -15.89% |
| 1966 | $1.7429 | $1.6970 | $1.9920 | $1.5670 | $1.7560 | 4.21% |
| 1965 | $1.5209 | $1.5010 | $1.7250 | $1.3820 | $1.6850 | 12.56% |
| 1964 | $1.6820 | $2.1930 | $2.2350 | $1.4020 | $1.4970 | -31.77% |
| 1963 | $2.0022 | $2.1060 | $2.1970 | $1.7650 | $2.1940 | 3.93% |
| 1962 | $2.0897 | $2.0630 | $2.1660 | $1.9940 | $2.1110 | 1.88% |
| 1961 | $2.0091 | $2.0840 | $2.1530 | $1.8500 | $2.0720 | -0.62% |
| 1960 | $1.9554 | $2.0470 | $2.0870 | $1.8170 | $2.0850 | 2.11% |

He is an expert in financial niche, long-term trading, and weekly technical levels.
The primary field of Igor's research is the application of machine learning in algorithmic trading.
Education: Computer Engineering and Ph.D. in machine learning.
Igor regularly publishes trading-related videos on the Fxigor Youtube channel.
To contact Igor write on:
igor@forex.in.rs
