The VIX 75 indicator, also known as the Volatility Index 75, is a significant tool in trading, particularly for those involved in the financial markets. Firstly, it measures the market’s expectation of volatility over the upcoming 30 days, providing traders with insights into the level of risk and uncertainty in the market.
High readings on the VIX 75 indicate increased volatility, signaling potentially larger but riskier price movements in the market. This can be especially useful for traders specializing in strategies that capitalize on market volatility.


Look below screenshot of TradingView platform that offers VIX:


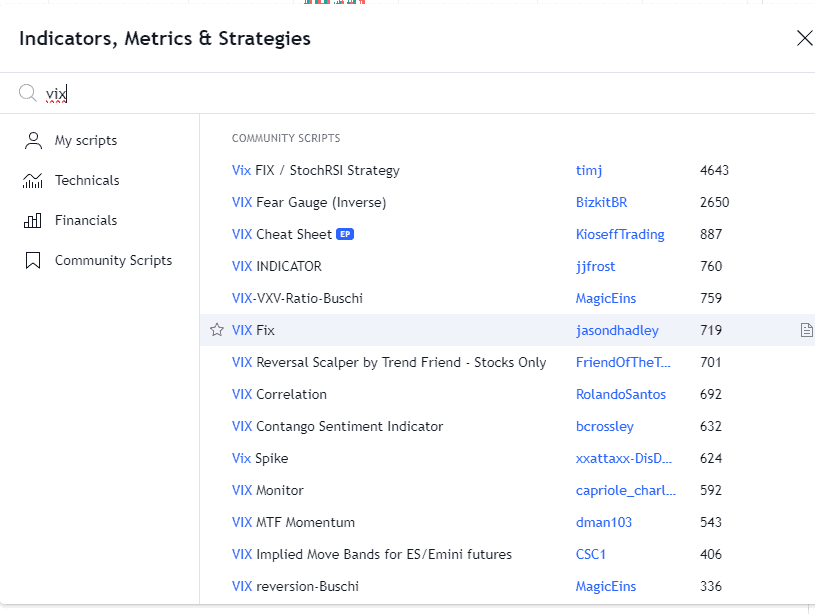


To find the VIX 75 indicator on the TradingView platform, you can follow these steps:
- Log into TradingView: First, ensure you’re logged into your TradingView account.
- Open a Chart: Select a chart for any financial instrument, as the VIX 75 can be applied to various market charts to gauge overall market volatility.
- Access the Indicators Menu: On the chart’s top, you’ll find an ‘Indicators’ button (it typically looks like a magnifying glass or a graph icon). Click on this to access the available indicators.
- Search for VIX 75: In the search bar within the indicators menu, type “VIX 75” or “Volatility Index 75”. It might also be listed under a similar name, so look for variants if you don’t find it immediately.
- Select and Apply the Indicator: Once you find the VIX 75 indicator, click on it to apply it to your chart. Depending on the indicator’s design, the indicator will be overlaid on your existing chart, or it might open in a new chart window below your main chart.
- Adjust Settings if Necessary: After applying the indicator, you can adjust its settings by clicking the settings icon (usually a gear icon) near the indicator’s name on your chart. This allows you to customize the indicator to fit your specific trading strategy or preferences.
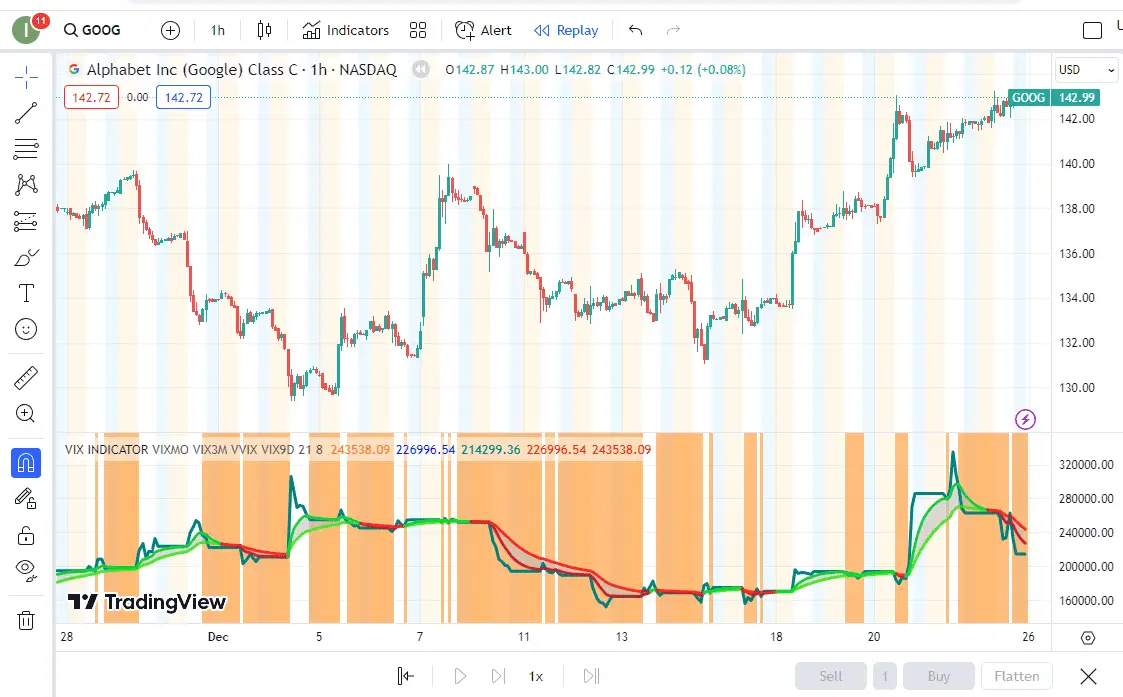
I prefer to use VIX Indicator and VIX Fix on tradingView.
Look what it looks like:
Using the VIX (Volatility Index) effectively in TradingView charts involves a strategic approach that can enhance trading decisions:
- Identify Market Sentiment: The VIX is commonly called the “fear gauge” of the market. A high VIX value typically indicates increased fear or uncertainty among investors, while a low VIX suggests confidence and stability. By observing these levels, traders can gauge overall market sentiment.
- Contrarian Indicator: Some traders use the VIX as a contrarian indicator. High VIX readings suggest high fear and might be interpreted as potential buying opportunities, as markets often rebound after extreme fear. Conversely, shallow VIX values, indicating complacency, might signal caution or potential selling opportunities.
- Volatility Breakouts: Traders can watch for breakouts in the VIX to anticipate significant moves in the market. A sudden spike in the VIX could precede large market movements, allowing traders to adjust their positions accordingly.
- Hedging Strategies: The VIX can be used for hedging against market downturns. When the VIX rises, indicating increasing volatility, traders might consider protective strategies, like buying put options or moving to safer asset classes.
- Correlation Analysis: Since the VIX often has an inverse relationship with major stock indices, traders can use it to identify divergences. For example, if the stock market is reaching new highs, but the VIX is also rising, it might suggest underlying market weakness.
- Combine with Other Indicators: To enhance the analytical value of the VIX, combine it with other technical and fundamental indicators. No single indicator should be used in isolation for trading decisions, and the VIX is most effective when integrated into a comprehensive trading strategy.

He is an expert in financial niche, long-term trading, and weekly technical levels.
The primary field of Igor's research is the application of machine learning in algorithmic trading.
Education: Computer Engineering and Ph.D. in machine learning.
Igor regularly publishes trading-related videos on the Fxigor Youtube channel.
To contact Igor write on:
igor@forex.in.rs
