Table of Contents
A Forex trader using the MT4 platform for quite some time will be well aware that the MT4 is not equipped with any indicator by default. Traders have to select a set of indicators and technical tools to get ahead with forex trading. These indicators help the traders by assisting them in understanding the market conditions and planning their actions.


Traders need indicators for many purposes. One such goal is to determine the support and resistance levels in the MT4 trading chart. The support and resistance levels are at the bottom and top of the price index chart. These levels signify the highs and lows of a tradable asset. With the help of these levels, traders can determine many essential elements of trading.


Since spotting such vital points in a chart is not easy, traders need to take the help of an indicator to trace these points more accurately on a chart. One such indicator to help traders draw support and resistance levels on a forex trading chart is the Auto Support and Resistance Indicator. This indicator helps in drawing the zones of support and resistance more precisely.


Read this article to understand more about this indicator, how it can be applied to your trading chart, and how to use it while trading.
Support and resistance indicator MT4 free download
Below you can download the auto support resistance indicator:
Download supply and demand zones indicator
See how It looks on the chart:
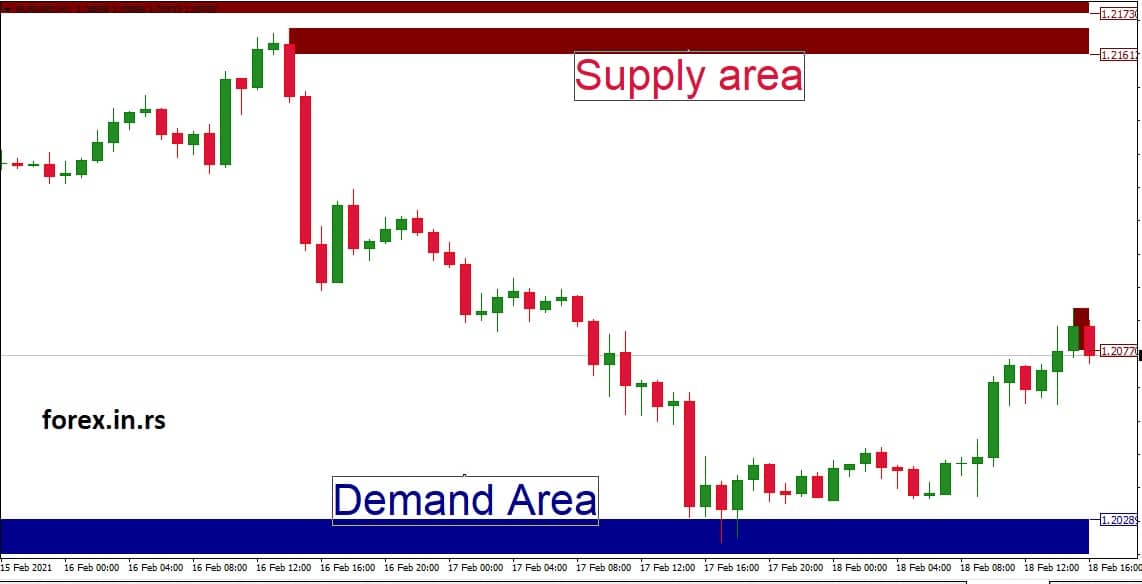
What Is the Auto Support and Resistance Indicator?
The Auto Support and Resistance Indicator help traders to automatically draw the resistance and support levels when applied to the MT4 Forex chart. It enables the trader to avoid spending time manually drawing these levels. Instead, they can utilize this time to understand the market conditions and make trading decisions.
When a trader applies this indicator to an MT4 terminal chart, it indicates the red resistance level and the blue support level. The resistance levels technically indicate that the traders are more interested in selling than buying. On the contrary, the support levels or zones show that buyers outnumber the sellers.
The Auto Support and Resistance Indicator are convenient for beginner and expert Forex traders. However, a new trader should practice drawing these levels manually. This will help them understand the positions of these zones more clearly. Also, they can take the assistance of this indicator to allow them to get more accurate with the manual practice.
The support and resistance levels help traders place the stop-loss and take-profit levels. It also helps in understanding which trend may take place. So, accordingly, they can either close their current position or decide to retain it and wait for a better opportunity. Apart from this, it also helps traders consider when to place the order or open a deal.
How To Draw Support and Resistance Levels?
The Auto Support and Resistance Indicator use market extrema to draw the support-resistance level. The fractal indicators present in this indicator help in drawing these levels. They are drawn where the number of these fractal indicators is higher.
Once you apply this indicator to your MT4 terminal, it will automatically plot a resistance and support level. Along with the level, it will show a number at the start of the level. This number indicates the number of fractals used to derive the level of support or resistance. If you click on the number, it will highlight the fractals used.
As the number of fractals decides the length of the resistance or support level, the height is derived by the distance between the upper and lower fractals. If there is more distance between these fractals, the higher the plotted level will be. On the contrary, less distance between the fractals signifies the lower height of the plotted level.
Due to this, as new fractal forms on the chart, the Auto Support and Resistance Indicator adjusts the height of the support or resistance level accordingly instead of drawing new levels.
How To Trade With the Resistance and Support Level Indicator?
Trading using the resistance and support level is simple, and most traders know its fundamentals. Trading with support and resistance levels is generally done at the breakouts or bounce backs. The support and resistance levels work as bars through which a trader can conclude the breakouts and bounce backs.
Let’s understand how a trader can trade through these bounce backs and breakouts of the resistance and support levels. The support and resistance levels set a limit for the price actions. If the price goes beyond these levels, it is known as a breakout. If this breakout happens outside of the resistance level, it can be profitable for those who wish to sell. Similarly, if the breakout occurs beyond the support level, it will attract more buyers.
Bouncebacks generally happen when the price reaches the possible high or low and retraces, resulting in the change of the current trend. The support and resistance levels help the traders determine where the movement can reverse. At these points, traders prepare themselves to change their positions.
Therefore, trading beyond these levels is profitable. Reading the resistance and support levels and, at the same time, considering the current trends can help traders choose the right path. This makes the Auto Resistance and Support Indicator important for traders.
Conclusion
Taking trade decisions using both trend lines and the support and resistance levels can be profitable for traders. The Auto Resistance and Support Indicator helps them automatically draw these levels on their MT4 terminal. Due to the high volatility in the forex market, it becomes essential for traders to use such indicators in highly volatile markets. In addition, with more accurately drawn support and resistance levels, other decisions like placing take-profit or stop-loss levels, determining the entry and exit points, or changing the buying or selling positions would also be accurate.
However, traders must accompany this indicator with other technical tools and indicators to stay ahead in the market.

He is an expert in financial niche, long-term trading, and weekly technical levels.
The primary field of Igor's research is the application of machine learning in algorithmic trading.
Education: Computer Engineering and Ph.D. in machine learning.
Igor regularly publishes trading-related videos on the Fxigor Youtube channel.
To contact Igor write on:
igor@forex.in.rs
